 Q3 2024 Earnings Call Transcript")
")
")
When I last covered the Direxion Daily S&P 500 Bear 3x Shares ETF (NYSEARCA:SPXS) for Seeking Alpha last July, I called the fund a “buy” and noted that timing was everything. If one judges the performance of that call over the last 12 months, which is a negative total return of about 45%, then that call looks quite bad in hindsight. However, and I’ve made this point in numerous leveraged ETF articles for Seeking Alpha, these products are not designed to be held as long term investments. Rather these are tactical trading products for experienced traders. What I said last July:
Because of the way the exchange-traded fund, or ETF, is constructed, shareholders who don’t actively manage positions on a short term time frame will see their capital decay away.
Thus, timing is everything.
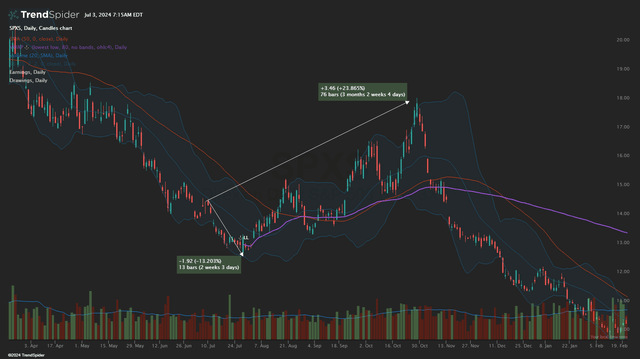
SPXS Daily Chart (TrendSpider)
While I was a little bit early last July, the price of SPXS did ultimately move 25% higher from my call when the markets corrected through October. In this update, I’ll make the case why the timing might be right again for another small speculative position in SPXS.
Risks And Logic
Before we get too far, I want to reiterate a point that I’ve made several times regarding leveraged ETFs. These are extremely risky products and shouldn’t be used for long term passive investment. 2x and 3x Leveraged funds are short term products for active traders. As a daily rebalancer, SPXS decays over time. Meaning it is imperative that traders get the timing right on direction and don’t stay in positions too long.
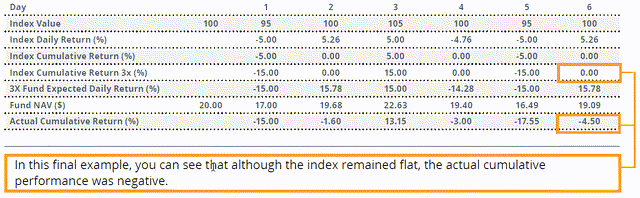
Decay Example (Direxion)
In the table above, Direxion shows how timing the fund wrong can lead to negative cumulative performance even when the underlying index is flat. The reason why I personally like using SPXS tactically over something like SPY puts is purely personal preference. I’d prefer to not time the market through short positions that could blow up a margin account or hold options that could expire worthless. For me, trading SPXS in a cash account is a fairly inexpensive way to make a bearish wager and maintain some capital to pull out even if I guess wrong.
The Setup
During my SPXS call last year, I noted several things that I felt would put downward pressure on stocks:
- Consumer health – spending with credit cards, falling savings rates
- Student loan forbearance
- Tech sector layoffs
- Rising yields
- Buffett indicator overvaluation
Admittedly, many of these things haven’t mattered. Tech layoffs have slowed down and student loan forbearance hasn’t had the impact I expected it to – in part, because the Biden administration is attempting forgiveness measures. But I think another factor that has mitigated forbearance is the rise of buy now, pay later loans. Despite the ability to kick the can down the road through BNPL loans, consumer health is still deeply problematic in my view.
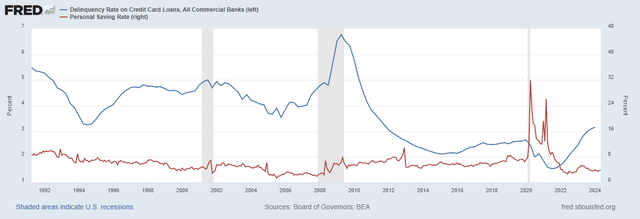
Savings vs CC Delinquency (FRED)
The personal savings rate is again near the depressed levels that preceded the great financial crisis and Q1 credit card delinquencies just hit the highest rate since 2011.
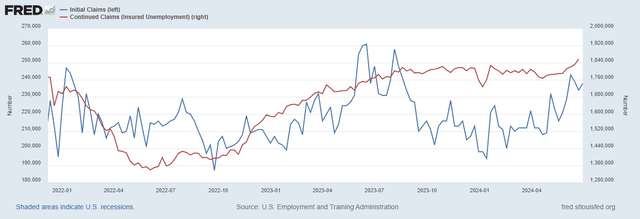
Jobless claims (FRED)
Additionally, jobless claims in June have ticked back up. Initial claims came in higher than expected for June 29th and continued claims are at their highest levels since 2021.
Valuations and “Fearful” Conditions
A year ago I said stocks were overvalued based on the Wilshire 5000 to GDP ratio – known as the “Buffett Indicator.” That ratio is now almost 200% and is at the highest reading since November 2021:
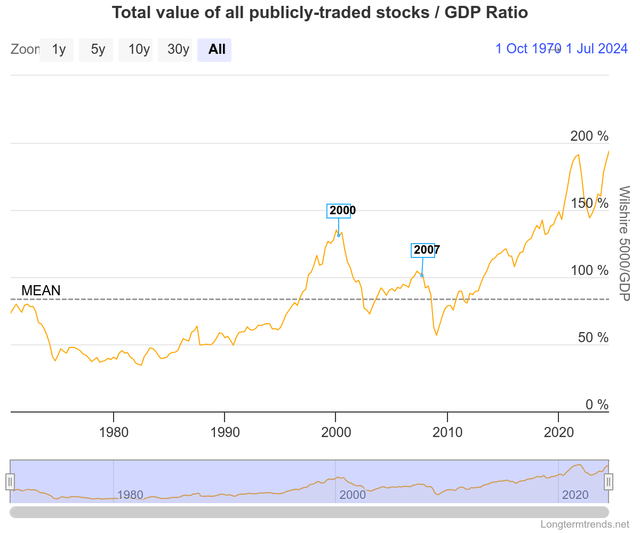
Buffet Indicator Screaming Sell (LongTermTrends)
I’ll remind you that the November 2021 peak in the Buffett Indicator was followed by a 27% decline in the S&P between January and October 2022. It’s not a real secret at this point that most of these S&P gains have come from a handful of hyped-up tech stocks.
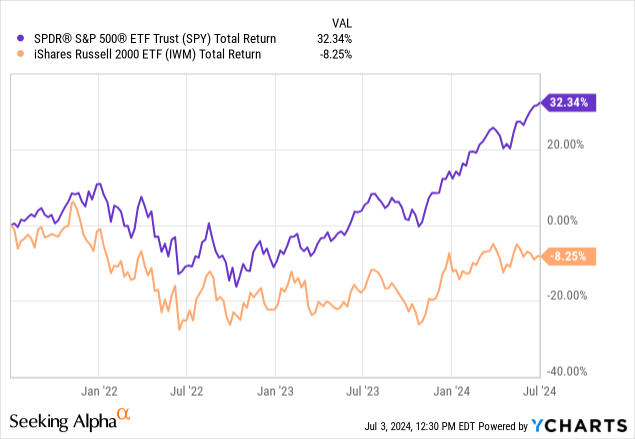
While the total return for SPDR S&P 500 ETF Trust (SPY) over the last three years has been 32.3%, the iShares Russell 2000 ETF (IWM) has still failed to regain 2021 highs. It’s easy to hand wave this away as strong companies simply outperforming because they have better revenue and earnings trends. But I think this is a sign of a larger problem. Consider the CNN Fear & Greed index:
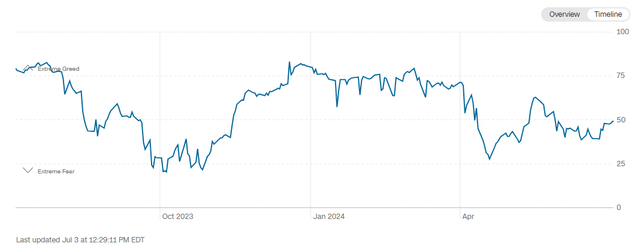
Fear and Greed, 7/3/24 (CNN)
With a current reading of 49, the market is anything but “greedy” based on CNN’s model. How could this be with markets at all time highs and lofty valuations? The index, which attempts to put a nominal assessment on sentiment, is constructed with underlying data that bases the output on conditions rather than just the price of the S&P 500:
The Fear & Greed Index is a compilation of seven different indicators that measure some aspect of stock market behavior. They are market momentum, stock price strength, stock price breadth, put and call options, junk bond demand, market volatility, and safe haven demand. The index tracks how much these individual indicators deviate from their averages compared to how much they normally diverge. The index gives each indicator equal weighting in calculating a score from 0 to 100, with 100 representing maximum greediness and 0 signaling maximum fear.
The CNN Fear & Greed index is just a few days removed from a “fear” reading despite a stock market index at all time highs. My interpretation of this is that the conditions reflected by the underlying data are generally experienced when the market is going down:
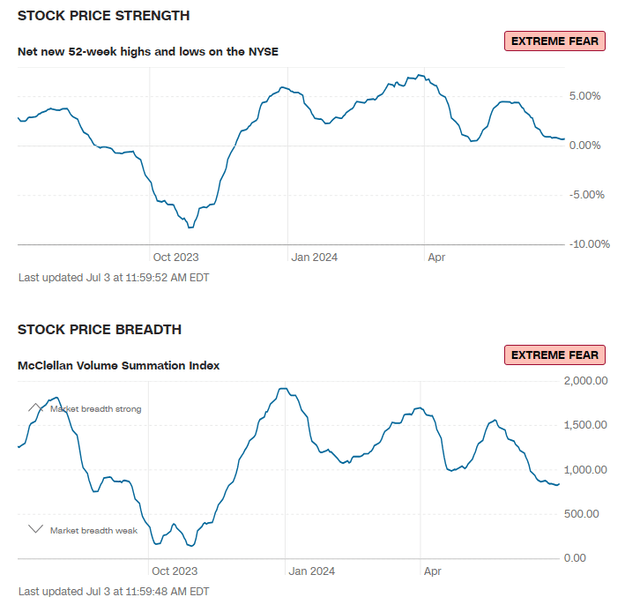
Fear & Greed Indicators (CNN)
The fact that the market is still going up despite poor market breadth and weak stock strength implies either the data doesn’t really matter – or – markets are way ahead of themselves because of momentum, AI, and Roaring Kitty’s triumphant return. I’m going with the latter.
Closing Thoughts
None of this stuff matters until it does. Typically, market meltdowns require some sort of catalyst that unwinds all of the perfection that had been previously priced into the market. We saw that type of catalyst in 2020 with COVID. 2022 was the year of rate hikes and asset roll off. What are some catalysts in 2024? That’s admittedly up to one’s own speculation, but might I suggest political uncertainty could be a fairly significant one:
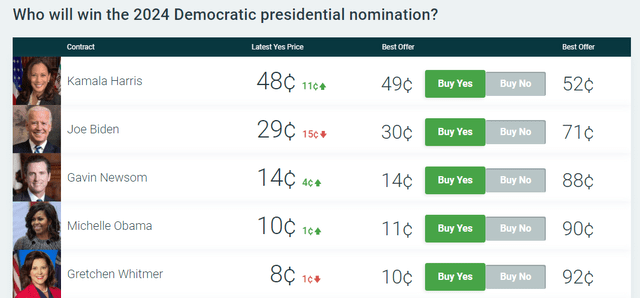
As of Noon on 7/3/24 (PredictIt)
With just four months remaining until the US presidential election, the calls for sitting President Joe Biden to step down from running for re-election later this year are intensifying following a live televised debate performance that can only be described as “poor.” Prediction markets that are based on futures contract trading are now starting to give current VP Kamala Harris the edge for the nomination over Biden. For markets that typically get cranky with uncertainty, the election later this year feels like it belongs in the “uncertain” category.
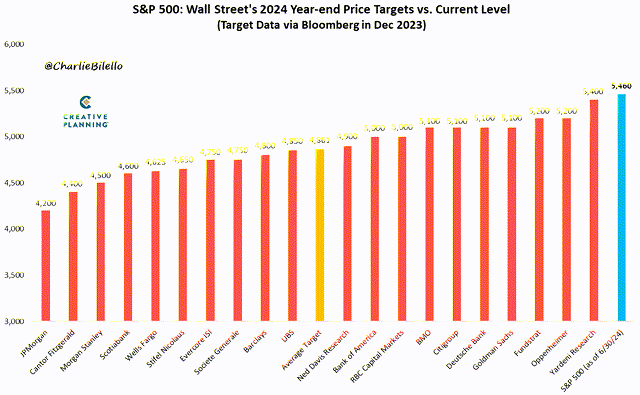
2024 Forecasts, June 28th 2024 (Charlie Bilello/X)
And yet, in just six months the S&P 500 has already surpassed even the most optimistic price targets for the end of 2024 from major analysts. To recap; economic data is weakening judging by consumer data and jobless claims, market breadth is abysmal, the market cap to GDP ratio is at nosebleed valuations again, every major analyst price target for 2024 has already been reached, and we’re four months away from an election where we don’t yet know for sure who is going to be on the ballot. All of this while bonds offer a positive real yield.
I think SPXS is an interesting trade again.
Read the full article here
 Q3 2024 Earnings Call Transcript")
")