")
")
 (OTCMKTS:DTEGY)")
")
 2024 Q3 – Results – Earnings Call Presentation (OTCMKTS:TBABF)")
")
Written by Nick Ackerman, co-produced by Stanford Chemist
The closed-end fund Sprott Focus Trust (NASDAQ:FUND) (MUTF:XFUNX) hasn’t performed very well since our prior update. The fund’s discount at that time, while at a double-digit discount, didn’t translate into a relatively attractive valuation. Some of the weaker performance was due specifically to the discount widening since our last update, but the portfolio mix was also the culprit.
As a portfolio that carries meaningful weight to materials and other value-oriented sectors, it just hasn’t been participating in the upside the broader market has been experiencing—which is primarily all driven by mega-cap tech names. More specifically, NVIDIA (NVDA) has been contributing to a significant portion of those gains.
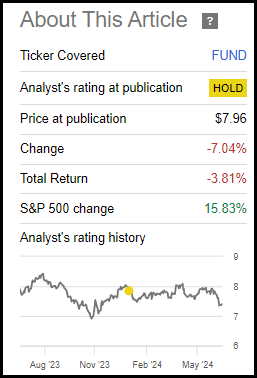
FUND Performance Since Prior Update (Seeking Alpha)
That said, with a now wider discount and one looking for more diversification from the tech-heavy broader market, FUND can still be a fairly decent choice worth exploring.
FUND Basics
- 1-Year Z-score: -1.42
- Discount: -12.53%
- Distribution Yield: 7.02%
- Expense Ratio: 1.15%
- Leverage: N/A
- Managed Assets: $252.5million
- Structure: Perpetual
FUND seeks to “deliver superior performance to investors by investing with a long-time horizon in high-quality businesses with strong balance sheets that are trading at attractive valuations.” The fund has no limit in terms of the market cap of the underlying portfolio. The average market cap weighting of their underlying holdings comes to around $3.09 billion, down from $3.43 billion earlier this year. That would tilt the portfolio to the lower end of the mid-cap range ($2 to $10 billion.)
The fund doesn’t incorporate any leverage in its strategy, which puts it in the minority of closed-end funds. With no leverage, volatility should be relatively more minimal compared to its leveraged peers. That said, FUND doesn’t have too many direct peers that would come to mind, given its more differentiated portfolio mix.
Still, it’s worth noting the no leverage aspect as some investors prefer to avoid adding greater risks that come with the higher volatility. It was also beneficial in the fact that it wasn’t a headwind with a higher rate environment, causing many funds to experience their borrowing costs rise astronomically.
On the other hand, it does leave it as a smaller fund in terms of total managed assets. A smaller fund often translates into lower liquidity due to lower average daily trading volume. FUND’s average daily trading volume comes to around 27k.
Performance – Discount Widening
Over the long term, this fund has delivered some attractive total returns. They were even competitive enough against the fund’s benchmark, the Russell 3000 Index. However, it has been faltering more recently and delivering some underperformance on both a NAV and market price basis. The fund’s mix of and specifically not investing heavily in the tech sector seems to be the obvious culprit to blame for this.
The Russell 3000 Index, while it attempts to be one of the broadest measures of the overall U.S. stock market, is still market-cap-weighted. Therefore, those largest names are going to contribute to the largest weightings in this index. For this index, tech has climbed to an allocation of over 33%. So, it essentially is just the S&P 500 Index, but with a higher number of rather meaningless allocations.
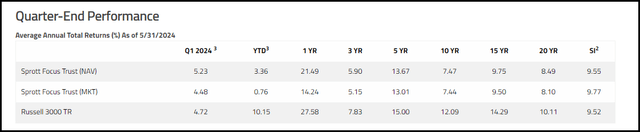
FUND Annualized Historical Performance Vs Benchmark (Sprott)
Where FUND can present an opportunity outside of its differentiated investment approach is through the discount/premium. In this case, the fund continues to trade at a relatively wide discount. The discount has widened since our last update, but it still isn’t necessarily in the bargain bin just yet.
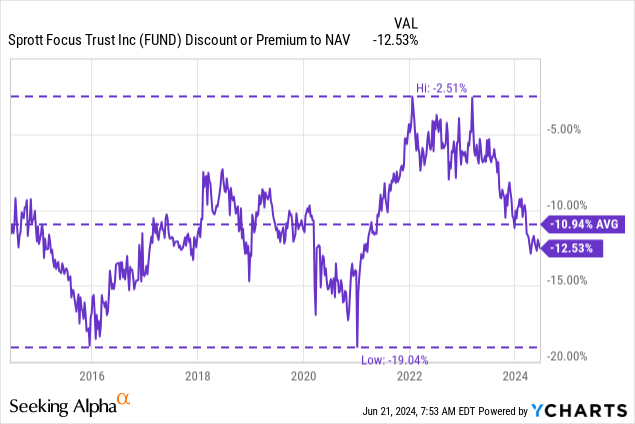
YCharts
This is a small fund that generally trades at a meaningful discount. Through 2022 and 2023, that period was more of an anomaly where the fund started trading at a shallow discount. That would make the more recent move back to double-digit discounts would have seemed more dramatic over the last year. While this is a small fund that might otherwise be a rather ideal target for an activist group, I wouldn’t expect anything like that to happen. George W Whitney, the portfolio manager, owns nearly 40% of the fund, making any activist campaign nigh impossible.
Distribution – 6% Managed Rate
With a declining share price since our last update, the fund’s distribution yield has also climbed a touch from our previous update. That can make it a bit more interesting for income-oriented investors. In terms of the NAV distribution rate, given the fund’s 6% managed distribution policy, it will always float around 6%.
Each quarter, they simply pay out 1.5% of the NAV—while the fund hasn’t been experiencing explosive returns this year, the fund’s NAV has been trending higher. Therefore, over the last year, we’ve seen the payout slowly rise each quarter.
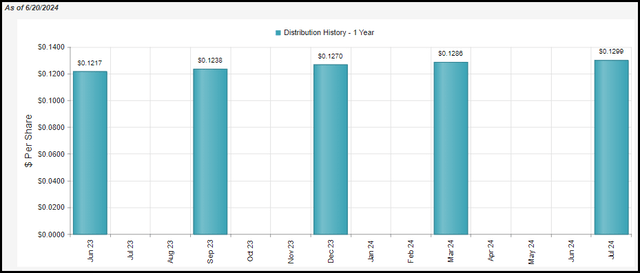
FUND Distribution History 1 Year (CEFConnect)
For the most part, 6% isn’t too egregious, and it could allow for some growth over time when also factoring in the fund’s expense ratio.
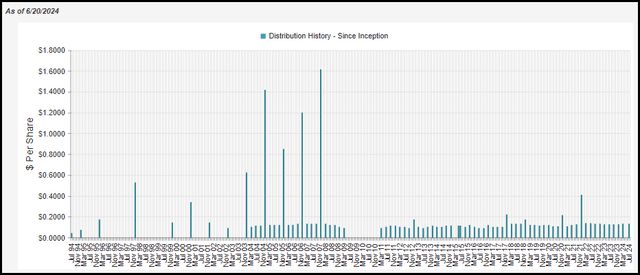
FUND Distribution History (CEFConnect)
Of course, the management team still has to be fairly successful, too. Given that they simply take 1.5% of the NAV and pay that out each quarter, the fund will need more than just the income generated from the underlying portfolio.
Like most equity CEFs, they will require capital gains to fuel a significant part of their payout to investors. Net investment income increased over the last year, but it still remains rather minimal. For example, at $0.18 earned for the entire year, that was enough to cover about 1.5 quarters’ worth of distributions the fund paid.
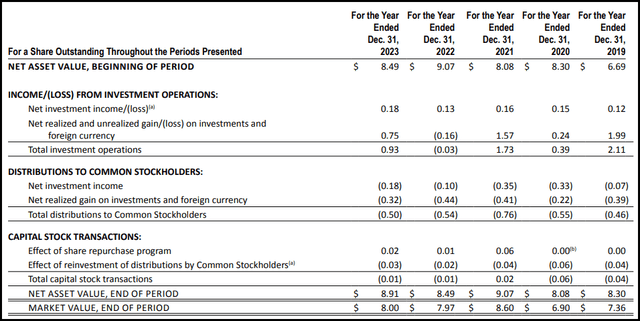
FUND Financial Highlights (Sprott)
The other point I’d like to point out in the financial highlights above is the effect of the share repurchase program. That has been beneficial in terms of seeing NAV accretion. However, that and more has been offset by the effect of reinvestment of distributions.
This is because FUND is one of those rather rare funds that implements a reinvestment policy where new shares are created for the DRIP, even when the fund is trading at a discount. Issuing new shares below NAV is why we are seeing the dilution of the NAV above. It only works out to a few pennies, but it is worth noting because while the share repurchase is beneficial, that benefit is essentially lost due to the DRIP policy.
For tax purposes, the distribution classification for the last two years has been ordinary income and long-term capital gains, which is in line with what we would expect.
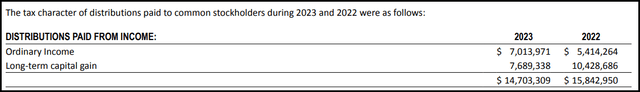
FUND Distribution Tax Classifications (Sprott)
FUND’s Portfolio
The largest exposure in this fund remains allocated to the materials sector, followed by energy, financials and then nearly equal weights of real estate and consumer discretionary. More specifically, the weights are: 38.9%, 14.4%, 13.5%, 8% and 7.7%, respectively.
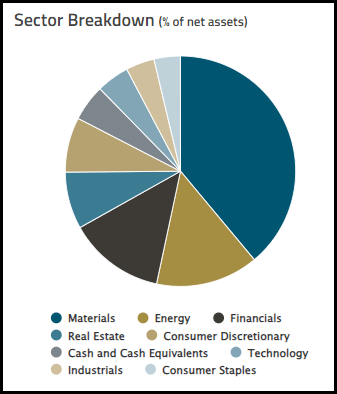
FUND Sector Allocation (Sprott)
That’s remarkably consistent with our prior look at the fund:
The fund still favors the materials sector at a 35.4% weight, followed by energy at 17.4%, financials at 14.9%, and then real estate at an 8.5% allocation. Consumer discretionary comes in at 6.3% and tech at 5.1%, with cash, industrials and consumer staples making up the remainder at all allocations of less than 4.5%.
Overall, the fund has seen its turnover pick up, but only rather marginally. The latest March 31, 2024, trailing annual turnover came in at 17.11%, up from 2023’s 14.64%. This helps highlight why we would have seen minimal changes in the fund with what is rather minimal turnover.
As we noted previously, the fund is also fairly narrowly focused, with only 36 total equity holdings listed. That was up from the 34 listed in our prior update, though that ultimately doesn’t change the fact that it is still a concentrated portfolio. At the same time, despite a narrow number of holdings, the percentage weightings don’t allow for too significant of an overweight in any single position.
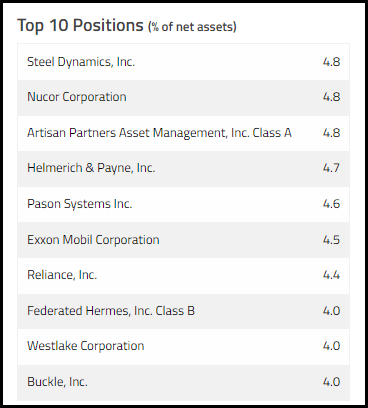
FUND Top Ten Holdings (Sprott)
A more narrowly focused portfolio can help drive better total returns. Of course, that also means having to select the right holdings as well. They have to be more successful in what holdings they choose to allocate to in order to generate potentially better total returns against their benchmark. As we saw in the annualized performance listed above, over the long term, they were able to provide competitive results but have been underperforming in all other periods.
We know that was a result of a lack of technology weighting and a heavier emphasis on value-oriented sectors.
The differences between FUND and its benchmark can further be seen in the comparisons below by looking at the P/E, P/B and dividend yields of the underlying holdings.
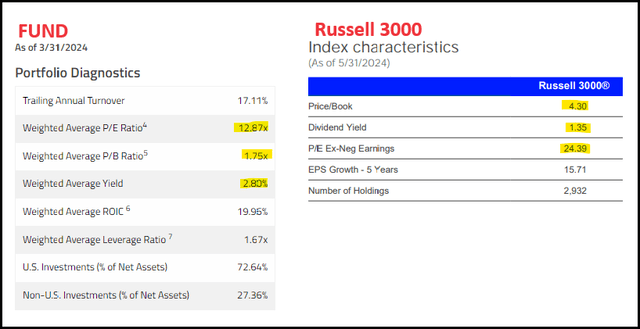
FUND Vs Russell 3000 Stat Comparison (Sprott and Russell)
The average market cap of the Russell 3000 holding comes to $790 billion. That can be compared with FUND’s holdings at an average market cap of $3.62 billion.
Conclusion
FUND has seen its discount widen since our prior update. However, it isn’t necessarily in the bargain bin just yet, which would leave me continuing to view the fund as more neutral at this time. Though I like that the portfolio is differentiated from the overall market, which has become increasingly tech-heavy. The management team is pretty clearly aligned with investors as well; with the portfolio manager having a massive 40% stake, he is definitely “eating his own cooking.”
Read the full article here
")
")
 (OTCMKTS:DTEGY)")
")
 2024 Q3 – Results – Earnings Call Presentation (OTCMKTS:TBABF)")