The refining business is rather unique in energy because refiners don’t benefit directly from higher oil or natural gas prices.
The best way to think about refiners is that they’re manufacturing firms; like all manufacturers, they convert various raw materials into finished goods used by consumers and businesses.
In this case, the largest single raw material for refiners is crude oil fed into their facilities and their finished goods include refined products like gasoline, diesel, jet fuel, heating oil and kerosene.
PBF Energy (NYSE:PBF) owns six refineries in the US with total daily throughput of a little over one million bbl/day of oil. As I’ll explain in this article, I believe the decline in US and European refining capacity in recent years coupled with still-high natural gas prices outside the US will keep crack spreads – a measure of refiners’ profit margins – at historically elevated levels, particularly in capacity-constrained markets like California.
In this article, I derive a valuation target of $71.50 for PBF, based on historic and peer valuation multiples, a more than 20% premium to the current quote.
Crack Spreads
Back on January 30, 2024 in a bullish article “USO: The US Oil Fund, 4 Reasons to Buy Crude,” on Seeking Alpha I wrote about crack spreads, a measure of refining profit margins, and their utility in helping assess the health of oil demand.
In that piece, I looked specifically at the calculation of the NYMEX 3-2-1 Crack Spread, which estimates the profitability of refining three barrels of West Texas Intermediate Crude (WTIC) oil into two barrels of gasoline and one barrel of ultra-low sulfur diesel.
However, the US refining market is regional in nature. Refineries in various parts of the US face different supply/demand conditions and use different crude oil feedstocks.
So, let’s look at PBF’s six refineries and the preferred measure of the crack spread for each:

PBF’s Refineries and Benchmarks (PBF 2023 10-K and February 28, 2024 Investor Presentation)
The US refined product market is divided into five Petroleum Administration for Defense Districts (PADDs) and PBF operates refineries in four of the five PADDs.
PADD 1 includes the entire East Coast, PADD 2 is the Midwest, PADD 3 is the Gulf Coast including the crucial refining states of Texas and Louisiana, PADD 4 is the Rocky Mountain states while PADD 5 is the West Coast, which is dominated by California.
PBF has two refineries on the East Coast – one in Delaware and one in New Jersey – with maximum throughput capacity of 335,000 bbl/day. PBF’s latest guidance anticipates 300,000 bbl/day of throughput in 2024 at the midpoint of the guidance range. Of course, refineries don’t always operate at maximum capacity and are taken fully or partially offline at times to perform maintenance or switch the mix of fuels produced.
Historically, refineries in PADD 1 source their crude via tanker and trade in the Atlantic market, producing refined products both for US consumption as well as for export to markets abroad such as Europe. PADD 1 is also historically reliant on imported refined products from Canada, Europe or elsewhere to supplement products refined in the region.
The key crack spread benchmark for PBF’s PADD 1 operations is what’s known as Dated Brent (New York Harbor) 2-1-1. Here’s how its calculated:

Dated Brent 2-1-1 Crack Spread (Bloomberg, Author’s Calculations)
Brent crude oil is a widely watched global crude oil benchmark. Technically, it’s named after the Brent oil field in the UK North Sea and is priced for delivery at Sullom Voe, an oil terminal located in the Shetland Islands of Scotland. However, due to the depletion of the Brent oilfield, the benchmark now includes a variety of light, sweet crude oils produced and priced in different parts of the world.
As I mentioned, East Coast refineries in the US have historically imported crude via tanker from Europe, Africa and other global markets; these crude oils tend to be priced based on a premium or discount to the Brent oil benchmark.
So, in calculating the East Coast 2-1-1 crack spread, we use the current price of Brent crude oil per Bloomberg of about $87.50 per barrel rather than the price of a US benchmark like West Texas Intermediate Crude. As I indicated, refiners like PBF buy crude oil as feedstock for their operations, so in the crack spread calculation I’ve included the cost of two barrels of Brent as a negative number, a cost of $175 (2 times $87.50).
Now, the crack spread calculation I’m using anticipates the refiner producing one barrel of Reformulated Blendstock for Oxygenate Blending (RBOB) gasoline and one barrel of ultra-low sulfur diesel (ULSD). Both RBOB and ULSD are traded as futures on the New York Mercantile Exchange (NYMEX) in US cents per gallon for delivery to New York Harbor (NYH).
There are 42 gallons in a barrel, so to calculate the value of one barrel of gasoline I first converted the price from cents per gallon to $/gallon and then multiplied by 42. Thus, one barrel of gasoline is worth $113.64 based on the price of May 2024 RBOB futures and one barrel of Ultra Low Sulfur Diesel (ULSD), also based on the May 2024 futures, is worth $106.93.
So, a company that refines two barrels of Brent into one barrel of RBOB and one barrel of ULSD can expect to earn a profit of $48.26. However, that’s based on two barrels of Brent and, by convention, crack spreads are quoted in $/barrel, so we divide by two to get the Brent (NYH) 2-1-1 crack spread of about $24.13/bbl.
This calculation isn’t a pure profit margin. After all, refiners face more costs than just the cost of buying crude feedstock, such as labor, maintenance expenses, the cost of natural gas used as a source of heat energy in a refinery and myriad other line items. However, it’s a good benchmark for the overall profitability of refining in PADD 1, and how the profitability of assets in the region change over time.
Let’s flip over to the opposite side of the country – PADD 5/West Coast – which is PBF’s most important in terms of expected total throughout in 2024. Indeed, as I’ll detail in just a moment, following recent refinery closures in California, PBF and Marathon Petroleum (MPC) are now effectively tied as the second-largest refiners in the state trailing only supermajor Chevron (CVX).
PBF’s two California facilities are located in Torrance in southern California, and Martinez, located near San Francisco in the northern part of the state.
Historically, California refineries have sourced their crude oil feedstock from local production – the state still produces some 300,000 bbl/day of oil — along with significant volumes from Alaska. Given the ongoing decline in output from both Californian and Alaskan fields, foreign sources account for an increasingly large portion of the state’s feedstock as well.
In 2023, for example, the California Energy Commission reports that California-produced crude accounted for 23.4% of volumes refined in the state, down from 36.9% a decade earlier in 2013. Meanwhile, Alaskan crude comprised 15.9% of supply last year while foreign sources chipped in 60.7%, the latter up from less than half as recently as 2011.
For both of PBF’s California refineries, the company uses the Alaska North Slope (ANS) oil benchmark to calculate the benchmark crack spread.
For northern California (Martinez), PBF uses the ANS (West Coast) 3-2-1 Crack Spread which is the per barrel margin of converting three barrels of ANS crude into two barrels of California Blend Gasoline (CARBOB), 1/4 barrel of California Blend Diesel and three-quarters of a barrel of San Francisco jet fuel.
And for southern California (Torrance) PBF uses the ANS 4-3-1 which it defines as four barrels of ANS crude refined into three barrels of CARBOB, 0.5 barrels of Los Angeles Diesel, and 0.5 barrels of LA Jet Fuel.
So, the crack spread calculation for Southern California looks something like this:

Southern California 4-3-1 Crack Spread (Bloomberg, Author’s Calculation)
As you can see here, the crack spread in southern California looks higher on this basis than the PADD 1 (East Coast) crack spread I calculated earlier. That’s because, while the cost of ANS and Brent crude is similar, the prices for California Blend gasoline, diesel and jet fuel are higher than the same commodities for delivery to New York Harbor.
Let’s look at a chart of the ANS 4-3-1 Crack spread in recent years:
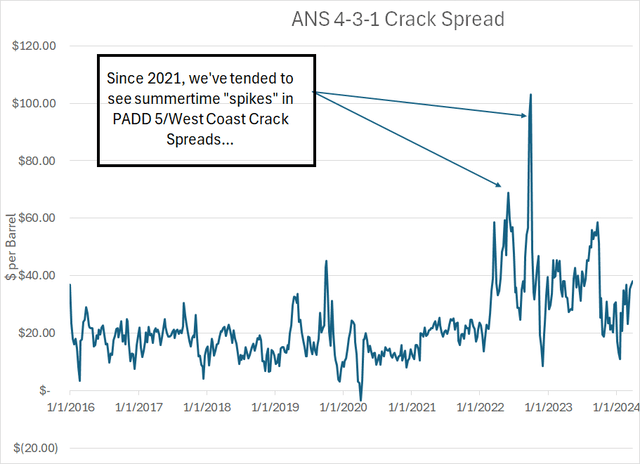
The ANS 4-3-1 Crack Spread since 2016 (Bloomberg)
Price quotes for the individual components of PBF’s southern California crack spread benchmark are available only on an irregular basis, so this chart is a similar benchmark calculated by Bloomberg. It’s the per barrel margin from processing four barrels of ANS crude oil into three barrels of California Blend gasoline and one barrel of California Blend diesel.
I’ve presented the weekly crack spread on this basis since early 2016.
Two points to note.
First, ANS crack spreads have generally risen since mid-2021 in California, implying higher raw profitability for California refineries.
Second, in the past few years, there’s been some notable volatility and “spikes” in PADD 5 crack spreads, particularly during the peak demand summer driving season.
Refinery Capacity Closures
The biggest problem facing the US refining market and the root cause of many of these spikes in California crack spreads is the loss of refining capacity in recent years:
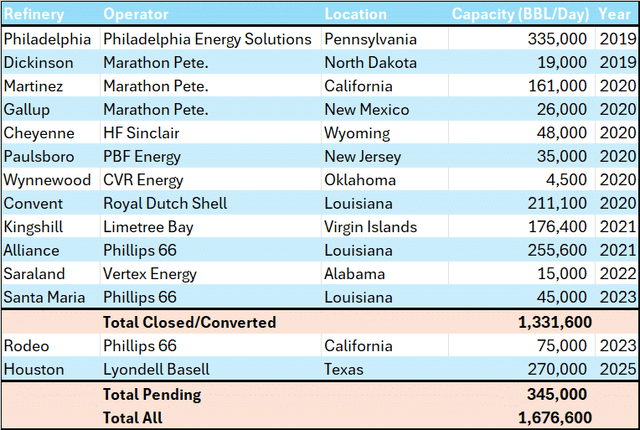
US Refinery Closures Since 2019 (Bloomberg)
This table represents a list of US refinery capacity closed since 2019.
Some of these refineries represent outright, permanent closures, while others are facilities that have been converted to other uses such as the production of renewable diesel. For example, Marathon Petroleum started converting its 161,000 bbl/day facility in Martinez, California to produce renewable fuels, primarily biodiesel, in 2020.
The facility ramped up to capacity last year of 730 million gallons per year of renewable fuels, which works out to an average of under 48,000 bbl/day of renewable fuel production.
Marathon performed a similar conversion at its facility in North Dakota in 2019 and Phillips 66 is finishing its conversion of its Rodeo refinery near San Francisco to produce up to 50,000 bbl/day of renewable fuels early this year.
Take a look at total refinery operable refinery capacity broken down by PADD on two dates per the Energy Information Administration (EIA):
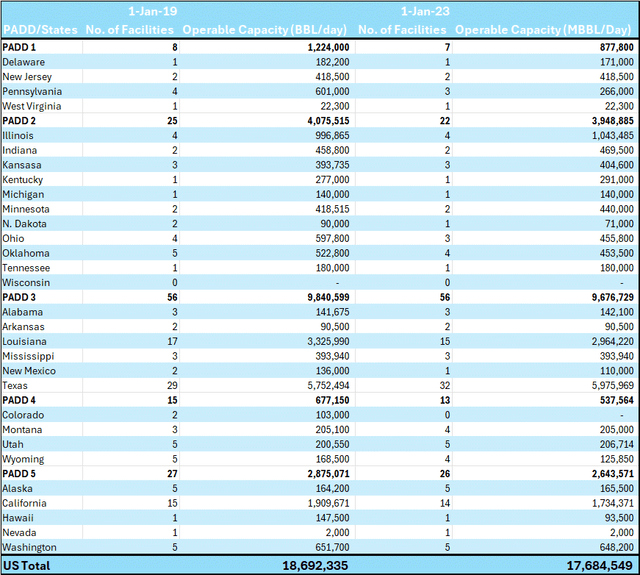
Operable Refining Capacity by PADD (Energy Information Administration (EIA))
I took this data from the Energy Information Administration’s annual Refinery Capacity Report, which is released each June.
The left-hand column on this chart shows all US refineries operating in each state on January 1, 2019 and the right-hand columns show the same data for January 1, 2023, a little over a year ago.
Take a quick glance at this list and you’ll see overall operating refinery capacity fell approximately one million bbl/day between these two dates. And look at the data for PADD 5. California is by far the most important state in PADD 5 when it comes to refinery capacity with about two-thirds of the region’s processing capacity.
However, between January 1, 2019 and January 1, 2023 California’s refining capacity fell by 175,300 bbl/day, mainly due to the closure and conversion of Marathon’s Martinez refinery in 2020, which I outlined earlier. However, on January 1, 2023, when the EIA conducted this survey, the Rodeo refinery was still operating; with that refinery now closed, California has lost close to 250,000 bbl/day of refining capacity in the past five years alone.
That’s a decline of more than 13%.
This is a significant issue, particularly when it comes to the gasoline market in California. The state uses a unique cleaner-burning gasoline blend, which costs more to refine; historically, California’s oil refineries were set up to handle this specific mix. However, with less capacity to refine oil into gasoline, the state runs the risk of inadequate supply, especially during periods of peak demand, forcing reliance on imported gasoline. According to the California Energy Commission, it takes about 3-4 weeks for the state to receive deliveries of imported California blend gasoline as refineries in most regions would need to retool operations specifically to produce the blend.
And while refineries converted to produce renewable diesel fuels can help supply the state’s diesel needs, these refineries no longer produce significant quantities of gasoline.
To make matters worse, importing gasoline via tanker is becoming increasingly expensive:
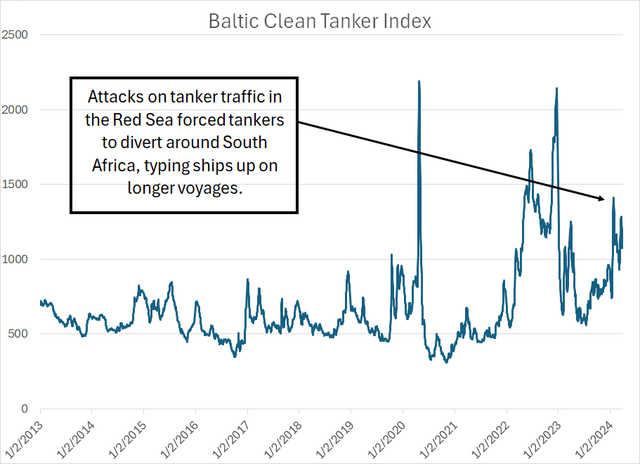
The Baltic Clean Tanker Index (Bloomberg)
This chart shows the Baltic Clean Tanker Index, an index of tanker rates primarily for the transport of refined products and chemicals.
Two salient features to note here.
First, while there has been plenty of seasonal volatility in tanker rates over the past decade, rates have become more volatile since 2020 and subject to higher-amplitude spikes.
Second, average tanker rates have been higher since 2020 than the pre-2020 average level.
Some of this reflects longer-term trends, such as a lack of newbuild refined product tankers built during a period of generally weak charter rates prior to 2020. However, recent geopolitical turmoil has exacerbated the issue. For example, recent attacks by Houthi militants based in Yemen targeting tanker traffic in the Red Sea prompted some shippers to divert traffic around the Cape of Good Hope (South Africa) to transport refined products and other commodities from the Middle East to Europe and the Atlantic Basin.
This diversion ties up ships on lengthier voyages and tightens the supply demand balance for ships, driving up tanker rates,
For example, it takes about 19 days for a tanker to sail from the Arabian Sea to Rotterdam in the Netherlands through the Red Sea and Suez Canal compared to a whopping 34 days to sail via the Cape of Good Hope.
Simply put, California gasoline prices need to rise enough to offset the increased tanker rates should the state need to attract imports of refined products. This also puts the state in competition with foreign importers of gasoline and diesel, including Japan and Europe, for available supply.
And, of course, it’s not just PADD 5 that’s experienced a meaningful decline in refinery capacity over the past five years – as I outlined in my table above, total US refinery closures since 2019 are set to approach 1.7 million bbl/day by the end of 2025, a decline of roughly 9% to 10% based on operational capacity in January 2019.
And it’s not just the US either.
Since 2016, Europe has lost 1.52 million bbl/day of crude oil processing capacity. And, so far this year Eni (E) announced the conversion of its Livorno refinery in Italy into a bio-refinery, Shell (SHEL) confirmed it’ll shut down its facility in Wesseling, Germany in 2025 and PetroIneos will shutter Grangemouth in Scotland next year.
One additional profitability headwind faced by EU refineries is the sky-high cost of natural gas in Europe.
The basic refining process requires heating up and cooling down liquids and most facilities use natural gas to provide this thermal energy:
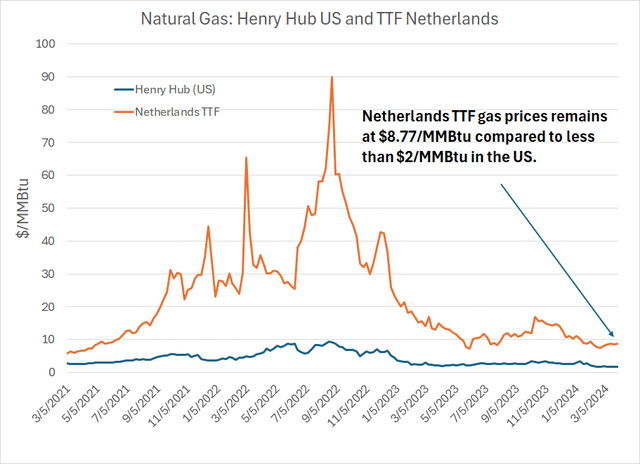
Netherlands TTF and Henry Hub Natural Gas Prices (Bloomberg)
This chart shows the price of front-month NYMEX natural gas futures in the US as a blue line and the Netherlands Title Transfer Facility (TTF) as an orange line. I’ve rebased the latter to the US pricing standard – dollars per million BTUs ($/MMBtu) – for ease of comparison.
While European gas prices are well off their 2022 peak levels, month-ahead TTF is still priced at $8.77/MMBtu compared to $1.842/MMBtu for front-month NYMEX gas futures. So, US refiners still enjoy an enormous cost advantage compared to their peers across the Atlantic.
Elevated Margins, Higher Valuations
The bottom line is US refining margins have been buoyant since 2020-21 as refinery closures have led to a tightening in available capacity to convert oil into products like gasoline and diesel. In certain key markets – like PADD 5 and California — the accelerated pace of refinery closures will likely continue to result in more extreme summertime spikes in refined product margins over the next few years.
While new refining capacity in the Middle East and Africa due for start-up over the next few years could help ease the supply squeeze, it will also render markets like Europe, and PADD 1 and PADD 5 in the US, more reliant on waterborne imports. Recent spikes in tanker rates catalyzed by geopolitical instability underline the potential cost disadvantages of overreliance on imported fuels.
Quality US-based refiners like PBF stand to benefit:
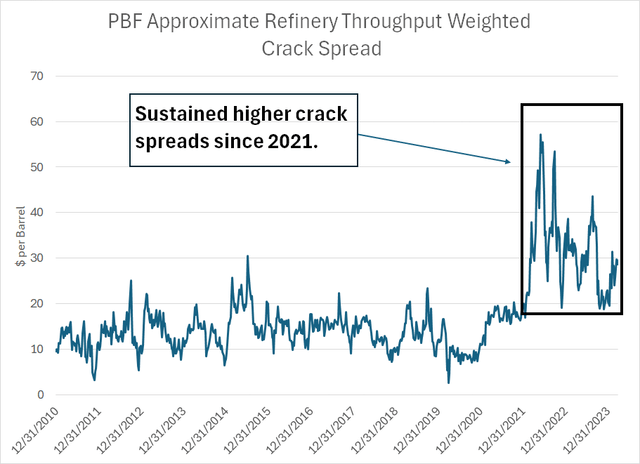
PBF Regional Throughput Weighted Crack Spreads (Bloomberg, PBF Energy 2024 Guidance)
To create this chart, I simply weighted the regional crack spread benchmarks outlined earlier by the company’s guidance for 2024 throughput broken down by region.
As you can see, crack spreads have been consistently elevated since 2021 compared to the 2010 to 2019 era, with the volatility and average level of spreads clearly strengthening following refinery closures starting in 2019-20.
PBF went public back in 2011 so, since its debut, refining margins haven’t been this consistently elevated; however, as you can see in my chart above, refinery margins were generally healthy from 2017 through 2019. Here’s a look at PBF Earnings Before Interest, Taxation, Depreciation, and Amortization (EBITDA) through those years:
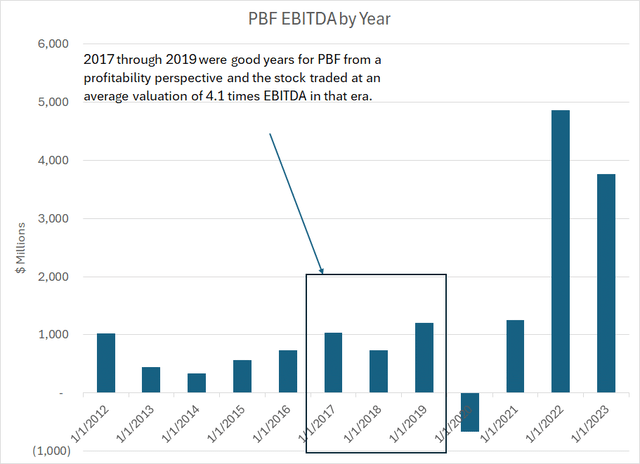
PBF Annual EBITDA since 2012 (Bloomberg)
As you can see, in both 2017 and 2019, PBF saw EBITDA over $1 billion annually, well above the 2013-2016 era. According to Bloomberg, based on quarterly closes over this time, PBF sold for an average enterprise value to trailing 12-month EBITDA (EV/EBITDA) ratio of 6.8 times.
Per Bloomberg, the mean consensus for 2024 EBITDA is $1.8 billion and the lower 2025 consensus EBITDA is $1.41 billion.
Here’s a look at the current valuations on this basis for PBF’s North American peers:
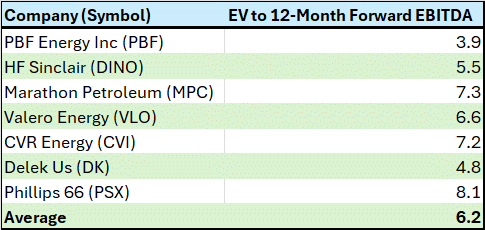
PBF Energy’s Refining Peers (Bloomberg)
This chart shows the current enterprise value to forward EBITDA multiples for six of PBF’s US-based peers; as you can see, PBF is the cheapest on this basis on the table.
So, here’s how I derive my price target for PBF:

Price Target Calculations for PBF (Bloomberg, PBF 10-K Annual Report)
Enterprise Value is a metric that includes the value of all PBF’s outstanding shares and net debt.
I’m using three different multiples here, including two based on lower 2025 consensus EBITDA ($1.41 billion) and one target based on higher 2024 consensus EBITDA ($1.80 billion).
Using the average EV/EBITDA trading multiple for PBF in 2017-19 of 6.8 times I get a price target of $76.36 and using the average valuation multiple for PBF’s peers of 6.2 times I get a price target of $69.33. Finally, I’m using a multiple of 4.8 times 2024 EBITDA estimates; this is the lowest EV/EBITDA multiple of any of PBF’s peers – Delek (DK) in this case – that yields a target of about $68.50.
Just taking a simple average of these three targets yields a price target of $71.50, which represents a premium of more than 22% to the current quote.
Conclusion and Risks
As with all energy companies, the biggest and most obvious risk is commodity prices.
In particular, refining margins are sensitive to demand for refined products like gasoline and diesel fuel and when the economy weakens, or falls into recession, demand and margins tend to decline. You can see that in my charts of crack spreads included earlier amid the recession of 2020.
My thesis is that refined product margins are likely to remain elevated over the next few years due to a loss of refining capacity and the growing need to transport refined products over longer distances to serve regional markets like PADD 5 and Europe.
However, a global economic slowdown would likely cause at least a temporary decline in margins and refining stock valuations.
I believe this risk remains modest. Indeed, groups like the International Energy Agency (IEA) have been revising their estimates of global oil and refined product demand higher this year and strength in physical market internals for oil, which I outlined in my Seeking Alpha piece on the US Oil Fund (USO), suggested upside risk for oil demand and prices as far back as early January 2024.
The second company-specific risk for PBF is its exposure to the California refining market – based on management’s 2024 guidance for throughput I outlined earlier, more than a third of PBF’s throughput this year will run through its two facilities in the state. The state has been among the most aggressive in targeting carbon dioxide emissions reductions, including a ban on the sale of new internal combustion engine (ICE) cars by 2035.
Indeed, according to the California Energy Commission zero-emission vehicles accounted for about 25% of all new vehicle sales in 2023 compared to a national average of about 16% for EVs and hybrids and around 7% for electric vehicles (EVs) specifically.
However, the actual impact on PADD 5 oil and refined product demand reported by EIA has been modest:
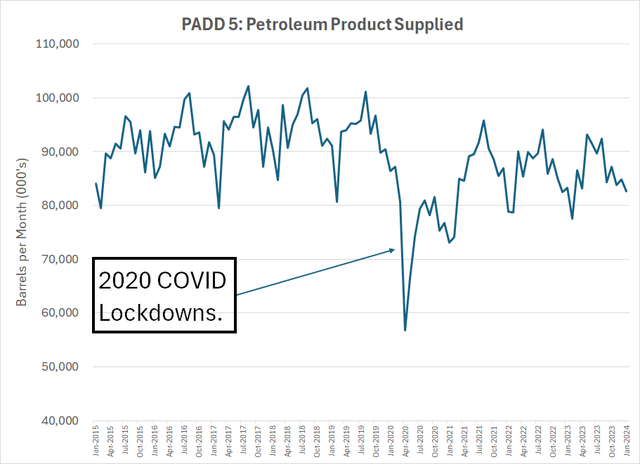
PADD 5 Petroleum Products Supplied (Energy Information Administration)
As you can see, demand collapsed amid COVID lockdowns in 2020 and has since recovered. Since 2021, PADD 5 oil and refined product demand has been stable at a lower level than pre-2020.
Indeed, PADD 5 mirrors the national pattern. According to the same dataset from EIA, total US petroleum products supplied in 2023 were up 1.79% relative to 2021. For PADD 5, total demand rose about 0.24% over the same period.
Simply put, while California’s EV mandates, and more aggressive carbon regulations across the entirety of PADD 5, may represent a longer term headwind for refiners in the region, the short term impact is easy to exaggerate. And certainly the 13%+ decline in refining capacity in California alone since 2019 dwarfs any near-term hit to oil and refined products demand.
Indeed, I regard PBF’s California exposure as a near-term upside catalyst amid the potential for tight supply conditions this summer that could inflate regional crack spreads and drive investor attention to the stock.
Bottom line: PBF Energy rates a buy with a conservative 12-month valuation target of $71.50.
Read the full article here


