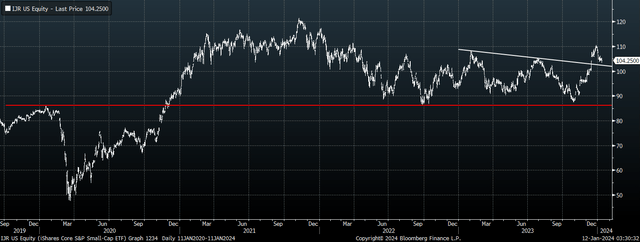
The iShares Core S&P Small-Cap ETF (NYSEARCA:IJR) has seen an impressive rally since my last note in early November, seeing a rare period of outperformance relative to large caps amid the downside reversal in bond yields. The pullback seen so far in 2024, driven by the recent rise in yields, provides another opportunity for investors to shift out of large caps and into small caps. The S&P 600 Small Cap index remains extremely cheap relative to the S&P 500, and the peak in bond yields appears to be in, which should allow the IJR to outperform significantly over the coming years.
The IJR ETF
The IJR tracks a market-cap-weighted index of primarily small-cap US stocks. The S&P Committee selects 600 stocks, representing about 3% of the publicly available market. The ETF has a significantly lower exposure to technology stocks and higher exposure to financial stocks when compared with large-cap stock indices, and has been much more responsive to changes in bond yields over recent months, allowing it to surge higher since October.
The IJR’s long-term trend of outperformance versus the iShares Russell 2000 ETF (IWM) looks set to continue as the far stricter criteria regarding the profitability continue to pay off. The IJR also has a lower expense ratio of 0.06% versus the IWM’s 0.19%.
After a 27% two-month rally to end 2023, this year has seen the IJR give back some of its gains, but the broader trend remains bullish. It appears to be consolidating gains above resistance-turned-support as the speculative buying and short covering that have fuelled the rally fade.
IJR ETF (Bloomberg)
Undervaluation And Bond Yield Peak Points To Continued Outperformance
While the IJR’s valuation discount has narrowed slightly since my last update in November as the market has moved sharply higher, the underlying S&P 600 is still valued at levels that imply over 10% annual long-term returns based on a cyclically adjusted PE date going back to the late 1990s. I also expect the IJR to outperform the S&P 500 by 10% annually over the next decade in total return terms as large-cap stocks return to near zero following their surge in valuations, which will eat into future returns.
The table below shows how undervalued small caps are relative to the S&P 500 on various measures. On average, the S&P 600 trades at its 5th percentile of relative valuations going back to 1995.
| Price/Earnings | Price/Free Cash Flow | Price/Sales | Price/Book | Price/Dividend | |
| S&P 600 Small Cap | 15.9 | 18.6 | 1.0 | 1.8 | 52 |
| S&P 500 Large Cap | 22.8 | 28.3 | 2.6 | 4.5 | 67 |
| Small Cap % Discount | 30% | 34% | 62% | 60% | 22% |
| Discount Percentile Since 1995 | 7th | 10th | 6th | 2nd | 1st |
The rise in valuations has been driven by the decline in bond yields, which has alleviated some of the pressure facing highly indebted sectors and in particular financials and real estate stocks, which have a high weighting in the index. After Treasury yields spiked to a peak of 5% on 10-year USTs and 2.6% on inflation-linked Treasuries in October, the peak in yields appears to be in. While yields may edge up further from here, the Fed’s dovish reaction to the October spike, which marked a significant change from the previous policy, suggests that the Fed will prevent a disorderly rise in yields, which has reduced a downside tail risk for the IJR.
Unadjusted Earnings And Rising Share Issuance Are The Main Risks To Consider
Aside from a period of broader market stress, there are two main risks facing the IJR that investors should look out for. First is the sharp decline we have seen in earnings excluding extraordinary items, which have fallen by half over the past year, resulting in an unadjusted PE ratio of 30x. Second is the spike in share issuance seen over the past year in the S&P 600, with the share count rising 15% in 2023 following years of net buybacks. Net buybacks have been one of the key drivers of the IJR’s strong long-term returns, and while the recent reversal may reflect a one-off recapitalisation of the banking system, it is still a risk to consider.
Read the full article here


