 Q3 2024 Earnings Call Transcript")
")

By John Baldi, Michael Clarfeld, CFA & Peter Vanderlee, CFA
Market Concentration Tests Rule of Prudence
Market Overview
The S&P 500 Index (SP500, SPX) rose 4.3% in the second quarter, putting it up 15.3% for the half year. Almost all of the quarter’s performance came from the information technology (‘IT’) sector. Within IT, just three stocks – Apple (AAPL), Microsoft (MSFT) and Nvidia (NVDA) – provided over 85% of all gains. Such market concentration is highly unusual and has significant implications for portfolio construction, particularly for broadly diversified, core portfolios.
From mainframes to tape storage, copy machines to fax machines, PCs to the internet and now smartphones to AI, phenomenal advances in technology have radically changed society and business. But one need not look back to the 1960s to see how the growth in technology has changed the game for equity investors. Just 10 years ago, the IT sector, as it was then constituted, made up 18% of the S&P 500. Today, those same companies represent over 40% of the S&P 500 (Exhibit 1).1 Going back to 1990, no other sector has ever represented more than 32% of the S&P 500, including IT at the peak of the dot-com bubble in 2000. One year later, after the bubble had burst, IT had shrunk to 18% of the S&P 500.
Exhibit 1: IT’s Growing Weight in the S&P 500
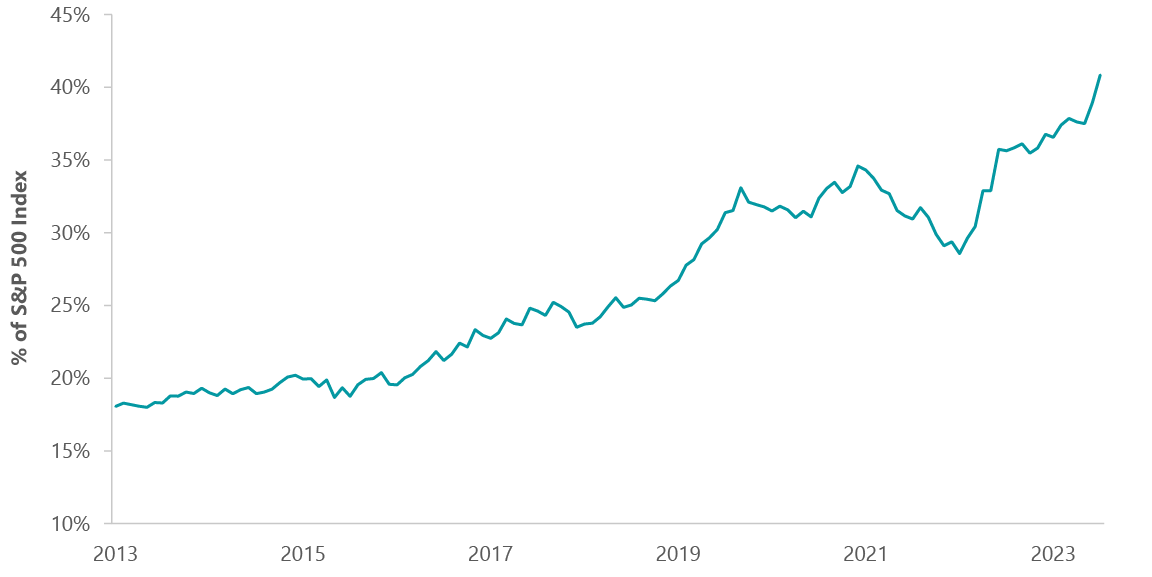
| As of June 30, 2024. Source: ClearBridge Investments, FactSet. Modified IT sector includes Alphabet, Meta Platforms, Visa and Mastercard. |
The issue of concentration at the single stock level is even more extreme. Apple, Microsoft and Nvidia – the three largest stocks in the market, all technology names – represent 20.5% of the S&P 500, or the equivalent of the bottom 362 stocks. Ten years ago, the top three stocks represented less than 7% of the total index, and two were technology stocks. Twenty years ago, the top three stocks constituted 8.5% of the total index and only one, Microsoft, was a technology stock.
Of course, the S&P 500 index is simply a market cap weighting of 500 of the largest public companies in the U.S. So, the growing proportion of technology stocks merely reflects the growing market value of these firms as they have become the largest and most profitable firms on the planet. Insofar as the S&P 500 benchmark reflects and measures the performance of 500 of the largest companies in the U.S., so far, so good.
The problem lies in how the S&P 500 often informs the investment process. The S&P 500 has always been thought of as a diversified benchmark. There is no obvious bright-line test for diversification, but at current levels it seems reasonable to ask: Is the S&P 500 still a diversified benchmark? If someone told you that the stock market consists of 11 sectors and then told you that they had put 40% of their assets in one of those sectors, would that strike you as being appropriately diversified?
“Observing the interplay of concentration, indexation and passive investing, we keep thinking: what the wise man does in the beginning, the fool does in the end.”
It is hard to imagine, but there was a time in investing when performance was not so rigorously judged against predetermined benchmarks. Stocks were held by the wealthy few, trading commissions were sufficiently high to preclude frequent trading/rebalancing, holding periods were measured in years instead of seconds, and the industry was, in a word, sleepier. In the 1970s this began to change as commissions were deregulated, 401k plans and IRAs were launched, and the mutual fund industry grew.
The seeds of accelerating change were planted in 1974, when John Bogle started Vanguard and launched index funds. Index investing is based on the logical observation, at the time considered radical, that the average investor is best served not by trying to beat the averages, but rather by mimicking them. By definition, the average investor is, well, average, so one should seek to mirror the benchmark at the lowest cost possible.
Yesterday’s iconoclasm has become today’s orthodoxy. Fifty years ago, the skeptics questioned how something as mindless as index investing could be so smart. Today, the complacent majority ignore that passively managed assets represent over 50% of all the assets in the stock market (Exhibit 2).
Exhibit 2: Majority of Assets Reside in Passive Strategies
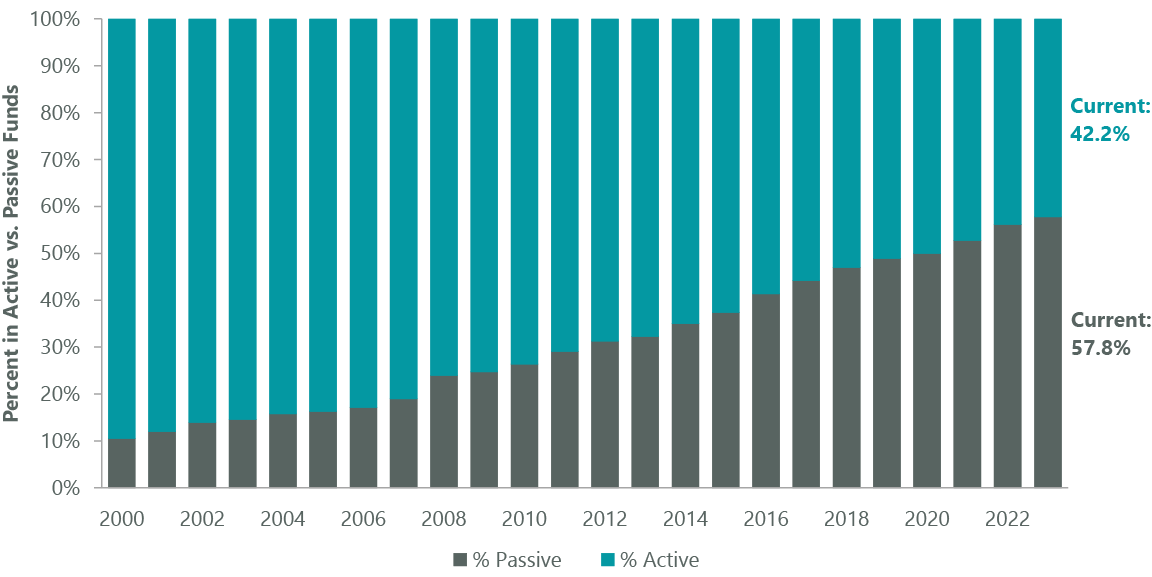
| As of Dec. 31, 2023. Source: Strategas, based on an analysis of data from the Investment Company Institute. Assets represent U.S. equities only. |
At the macro level, indexing undoubtedly made sense when it represented a sliver of the market, effectively and efficiently free-riding on the investment decisions of the active majority. But today, stock moves reflect passive money flows rather than active investment decisions. Is society best served by having half our capital allocated without any intentionality whatsoever? It seems time to wonder: has the blind embrace of passive investing jumped the shark?
At the portfolio level, the tremendous growth in passive investing has had two effects relevant to our discussion. First, the combination of indexation and passive investing has made everyone hyperconscious of relative performance. Without reference to a benchmark, gains of 10% in a year sounds great. But if the benchmark is up 12%, those gains may not taste as sweet. On the flip side, investors have come to accept that they should be happy when they are down 12%, so long as the market is down more.
We do not suggest that there is no place for benchmarks in investing. There is clearly a need for an objective scorecard to judge performance. But as benchmarks have become pre-eminent, reflexivity has been introduced. Rather than providing an impartial yardstick to measure performance, benchmarks have altered the outcomes they were supposed to be measuring. This aspect of indexation reverberates throughout all corners of the market, but is most marked for portfolio managers of diversified, core portfolios.
If tech represents 40% of the benchmark and is up more than 3x the other 60% of the market – as with the S&P 500 so far in 2024 – then it is all but impossible to outperform the benchmark without having more than 40% of one’s assets in IT. The risk that comes from putting close to half of one’s primary equity allocation in a single sector (a la the S&P 500 today) cannot be optimized away.
Asset managers have a fiduciary duty to their clients. The fiduciary duty is based on the prudent person rule. When acting as a fiduciary, one must ask “Am I conducting myself in a way that a prudent person would conduct their own affairs?” For a diversified equity manager aiming to beat the S&P 500, the test effectively becomes this “Would a prudent person put more than 40% of their primary equity allocation in one sector?” The answer, of course, speaks for itself.
On the way up this issue of concentration is not a problem. In fact, it is likely a positive: increases in one stock pull along the share prices of peers, creating self-reinforcing momentum. A recent academic paper makes a similar case, arguing that passive inflows drive systematic increases and overvaluation of the largest names.2 But on the way down this concentration will sting badly.
As we sit here seemingly approaching the apogee of this concentration phenomena, a conservative manager writing about these risks (yours truly) may well be mocked by some as having sour grapes on account of missing out. But, as we observe the interplay of concentration, indexation and passive investing, we keep thinking… what the wise man does in the beginning, the fool does in the end.
Portfolio Positioning
While the market has become more concentrated and less diversified over time, ClearBridge Dividend Strategy (MUTF:SOPAX) has not. Diversification by sector and name has always been a hallmark of our process and that remains doubly true today (Exhibit 3). We have never built our portfolios based on relative benchmark positioning, but rather from the bottom up to deliver on our objectives for clients: 1) provide an attractive upfront return 2) invest in companies with nicely growing dividends and 3) invest in a conservative and prudent manner.
Exhibit 3: ClearBridge Dividend Strategy’s Diversification by Sector
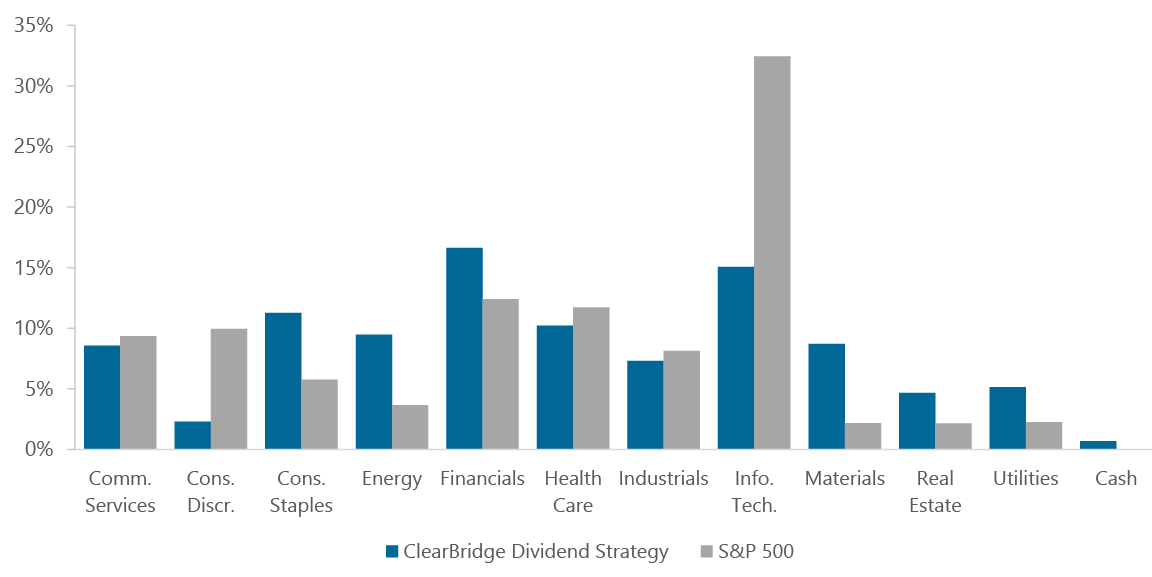
| As of June 30, 2024. Source: ClearBridge Investments, FactSet. |
As valuation multiples have increased over the last 18 months, despite higher interest rates, we have continuously sharpened our pencils on valuation. We have winnowed our most at-risk expensive stocks and, on the whole, redeployed those proceeds into solid investments with less demanding valuations which should be more resilient whenever turbulence returns.
In the second quarter we continued this process. In consumer staples we added to Haleon (HLN) and Nestle (OTCPK:NSRGY). We continue to find high-quality staples undervalued, as they trade at discounts to the market rather than their usual premiums. We added to META on weakness as we continued to build out the position. We increased our position in Air Products and Chemicals (APD) after the company announced a major offtake agreement for its Neom green hydrogen project. Investors were concerned about the risks embedded in APD’s backlog of hydrogen plants – this contract should dispel these concerns and validate the company’s strategy. At the same time, we trimmed Mondelez (MDLZ) to manage potential headwinds from rising commodity costs and Microsoft to capture some recent profits.
In terms of performance, S&P 500 market returns for the second quarter were more subdued than in the last two quarters, weighed down by cyclical sectors amid slowing macro indicators. IT and communication services continued to lead thanks to AI fervor and served almost as a safety trade. Along these lines, the defensive consumer staples sector held its ground, rebounding from oversold levels.
Communication services gains in the S&P 500 were driven mainly by Alphabet (GOOG,GOOGL, aka Google). The company has a dominant position in internet search and video advertising, and a solid cloud services business. Alphabet’s initiation of a dividend in the quarter enabled us to take a small position. We see further meaningful revenue opportunities from AI innovations across its segments and may look to increase our holdings over time. Alphabet’s exceptional balance sheet and improving cost efficiencies further solidify its strong position and growth prospects, and we expect its dividend will grow sharply over time.
The recent addition of Alphabet and Meta reflect the benefits of our flexible dividend approach. Our active (as opposed to formulaic) approach to dividends enabled us to move quickly and buy the shares soon after each announced its dividend. Over the years, our nimble approach to dividend investing has frequently enabled us to profit from long-term investments in high-growth technology companies that many passive or formulaic dividend investors likely missed (e.g., American Tower, Mastercard, Meta, Visa).
Utilities rose largely on merchant power companies serving the data centers powering AI; the rest of the sector, along with real estate, suffered as rate cut expectations were pushed out. One exception was our holding Sempra (SRE) – a well-managed and diversified utility holding company. Sempra possesses large franchises in Texas and California, as well as a large LNG business. Sempra is a leading player in each of its markets and all its segments enjoy robust growth outlooks, which should drive high-single-digit growth for the company overall.
Given the Strategy’s diversification and core focus, it is not surprising most of its underperformance in the quarter was due to sector allocation. In particular, our underweight to IT and overweight to materials and energy, weighed on performance.
Stock selection in energy, however, made the strongest relative contribution. Our focus in energy is on midstream pipelines, with their lower commodity exposure and defensive cash-flow-generative profile. These stocks performed well due to strong execution, an improving natural gas price outlook and growing acknowledgment midstream infrastructure plays a key role to back up renewable power as AI demand grows.
Within IT, Intel (INTC) was the main detractor. Intel’s shares declined as higher profitability targets were pushed further out in the decade and skepticism lingers on the company’s ability to reclaim tech leadership. Our current position is modest in the context of the overall portfolio.
Outlook
Our expectations for the economy continue to be relatively sanguine. While activity is slowing steadily, we do not anticipate a recession in the near term. We continue to believe that investors are overestimating the likelihood and magnitude of potential interest rate cuts. Today’s interest rates are not particularly high by historical standards and we think the Federal Reserve will take its time.
Investors so frequently lament the myriad risks in the world, that it may sound like crying wolf. Just this century, we have survived: 9/11, the global war on terror, the dot-com bubble, the housing bubble, COVID-19 and the polarization of American politics. During each of these periods, investors have fretted, and each time the markets have persevered.
Nevertheless, the quantum and scale of risks in the world today seems truly unprecedented: wars in Ukraine and Israel; pivotal elections in France, the U.K. and the U.S.; and unsustainable fiscal policies in many countries. Risk means more things can happen than will happen. Surely not all these threats will come home to roost. Indeed, none of them may amount to more than a hill of beans. Prudence, however, requires embracing caution amid such uncertainty. With price-to-earnings ratios near all-time highs, however, the market seems to be ignoring these risks (Exhibit 4).
Exhibit 4: S&P 500 Valuations Have Risen Dramatically
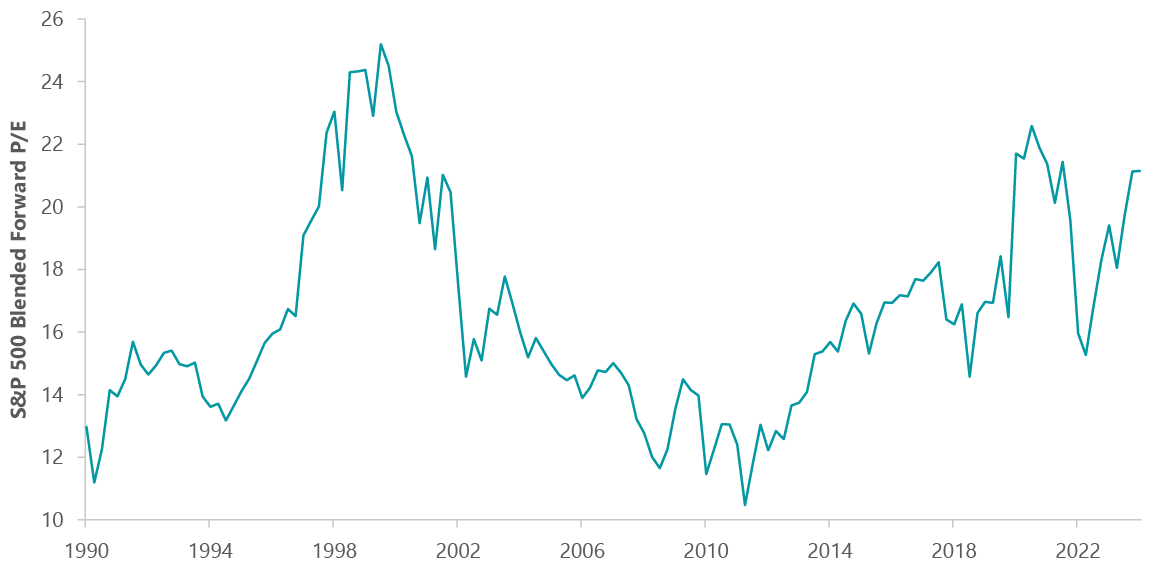
| As of June 30, 2024. Source: ClearBridge Investments, FactSet. |
We expect continued earnings growth and robust dividend growth from our companies. These dividends should provide cushion amid bouts of volatility and preserve purchasing power, regardless of the trajectory of inflation. Our diversified portfolio of high-quality dividend growers is built for all weather.
Portfolio Highlights
The ClearBridge Dividend Strategy underperformed its S&P 500 Index benchmark during the second quarter. On an absolute basis, the Strategy saw positive contributions from four of 11 sectors in which it was invested for the quarter. The IT sector was the main positive contributor, while the materials and financials sectors detracted the most.
On a relative basis, stock selection and sector allocation detracted. In particular, stock selection in the communication services, IT and consumer staples sectors, an underweight to the IT sector and overweights to the materials, energy and financials sectors weighed on relative results. Conversely, stock selection in the energy and real estate sectors and an underweight to the consumer discretionary sector proved beneficial.
On an individual stock basis, the main positive contributors were Broadcom (AVGO), Apple, Williams Companies (WMB), Oracle (ORCL) and AvalonBay (AVB). Positions in Intel, Travelers (TRV), Comcast (CMCSA), Diageo (DEO) and Vulcan Materials (VMC) were the main detractors from absolute returns in the quarter.
In addition to portfolio activity discussed above, holding Pioneer Natural Resources was acquired by holding Exxon Mobil (XOM), in the energy sector.
John Baldi, Managing Director, Portfolio Manager
Michael Clarfeld, CFA, Managing Director, Portfolio Manager
Peter Vanderlee, CFA, Managing Director, Portfolio Manager
|
Footnotes 1 During the last ten years, the S&P 500 has moved several of these names out of the IT sector to prevent the IT sector from appearing too big relative to other sectors. Most notably, it has done this by moving Visa and Mastercard to financials and Meta and Alphabet to communication services. 2 Passive Investing and the Rise of Mega Firms by Jiang et al NBER June 1, 2024. Past performance is no guarantee of future results. Copyright © 2024 ClearBridge Investments. All opinions and data included in this commentary are as of the publication date and are subject to change. The opinions and views expressed herein are of the author and may differ from other portfolio managers or the firm as a whole, and are not intended to be a forecast of future events, a guarantee of future results or investment advice. This information should not be used as the sole basis to make any investment decision. The statistics have been obtained from sources believed to be reliable, but the accuracy and completeness of this information cannot be guaranteed. Neither ClearBridge Investments, LLC nor its information providers are responsible for any damages or losses arising from any use of this information. Performance source: Internal. Benchmark source: Standard & Poor’s. |
Original Post
Editor’s Note: The summary bullets for this article were chosen by Seeking Alpha editors.
Editor’s Note: This article discusses one or more securities that do not trade on a major U.S. exchange. Please be aware of the risks associated with these stocks.
Read the full article here
 Q3 2024 Earnings Call Transcript")
")