")
")
 (OTCMKTS:DTEGY)")
")
 2024 Q3 – Results – Earnings Call Presentation (OTCMKTS:TBABF)")
")
At one point on Thursday, June 20, Nvidia Corporation (NASDAQ:NVDA) reached a market capitalization of USD $3.45 Trillion, making it the most expensive stock in the world. While the stock has since given back $200B, at $3.25T it still trades at an astonishing 77x multiple on $42B of trailing earnings. The following charts just how crazy this valuation is in a historical context and relative to the rest of the market. The key point is not just that the stock trades at extreme multiples, but that such high multiples are extremely rare for large, established businesses.
1: The first chart shows how NVDA compares with other more reasonably valued top 100 stocks S&P 500 (SP500) stocks. These 9 stocks have combined trailing earnings of $219B and sales of $1.3T, more than 5 times and 18x the figures of NVDA.
Bloomberg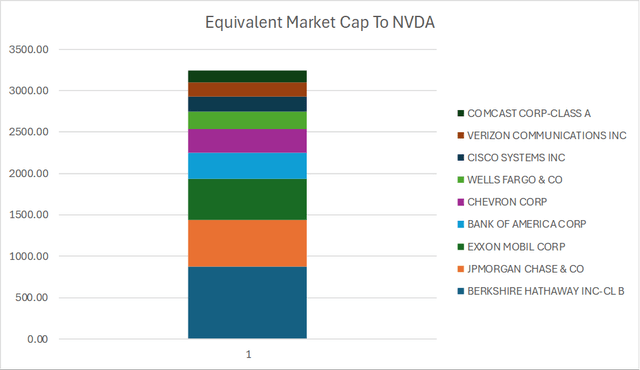
2: The next chart shows how NVDA has now surpassed the market cap of some of the world’s largest equity indices. The stock is now worth more than the UK’s FTSE 100, the France CAC 40, and Hong Kong’s Hang Seng Index. Each of these indices generates sales exceeding $2T annually.
Bloomberg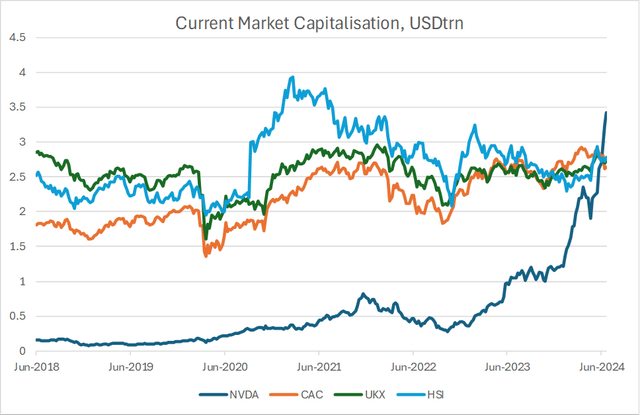
3: The next chart shows the close inverse correlation between the price to sales ratio and nominal sales for the larges 200 US companies. Generally speaking, the higher the level of sales, the lower the multiple that investors apply to those sales. The reason being, it is difficult to maintain high profit margins and strong sales growth when sales are already high. Nvidia stands out in this regard, having by far the highest P/S ratio despite generating $80B in revenues.
Bloomberg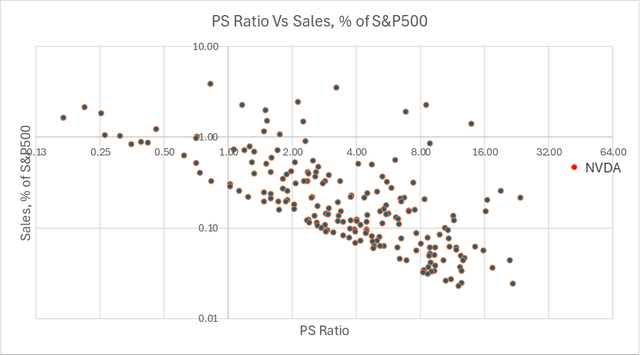
4: Next up, we have a chart of the P/E ratio of the largest stock in the S&P 500 over time going back to 1994, alongside the P/E ratio of the overall index as well as the Mid-Cap index. The majority of the time over the past 20 years, the largest stock has traded discounted to the overall market and a particularly large discount relative to Mid-Caps to reflect the weaker growth prospects of large companies. The current 77x multiple for NVDA stands out as being extremely high on a relative basis, exceeding the extremes of Microsoft (MSFT) in 1999.
Bloomberg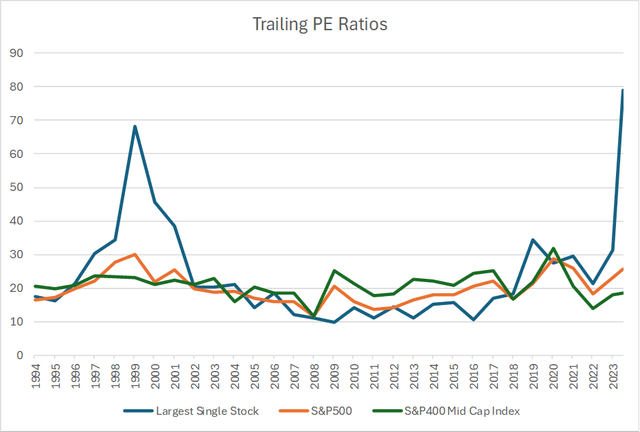
5: The next chart shows how large Nvidia’s market capitalization is when compared with the free cash flows of the entire Nasdaq 100-Index (NDX). At $3.25T, NVDA’s market cap is almost 5x the entire market’s free cash flows, while the combined market cap of Nvidia, Apple (AAPL), and Microsoft is almost 15x. In comparison, at the 2009 and 2012 valuation lows, the entire Nasdaq 100 traded at a price to free cash flow ratio of around 12x. This means that if the entire Nasdaq 100 were to trade at a price to FCF ratio of 12x again, NVDA would have to generate 43% of the entire market’s free cash flows to justify its current market cap.
Bloomberg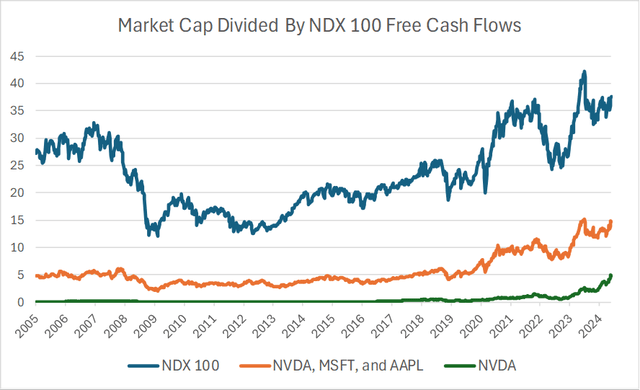
6: At some point in the future, investors are likely to realize that large companies grow much more slowly than small ones over the long term and start to apply significantly lower valuation multiples to Nvidia. The next chart shows the combined and median annual sales growth for Microsoft, Apple, Amazon (AMZN), Google (GOOG), Meta (META) and Tesla (TSLA). Both figures are now below 10% and barely above the growth rate of the S&P 500. I think it is inevitable that their growth rates will fall below that of the overall market over the coming years and while Nvidia may continue to post double-digit growth rates for a few years, it will also face the same fate.
Bloomberg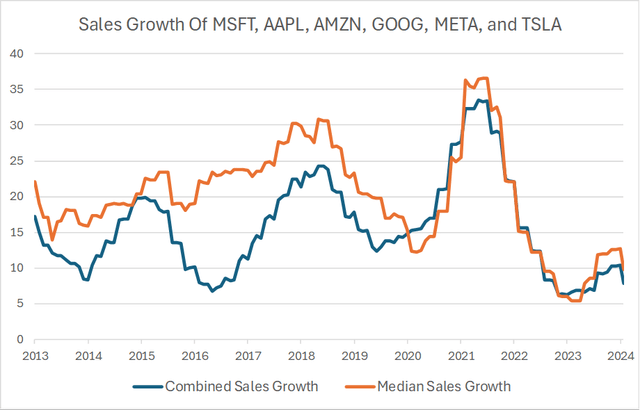
7. The final chart shows how Nvidia’s annual sales growth will inevitably decline rapidly over the coming years. It assumes that annual revenues increase by $59B in FY2025 and another $40B in FY2026 in line with analyst estimates, and then rise by an additional $30B per year thereafter. Nvidia’s annual sales growth rate would drop below 10% by FY2032, having reached $341B. Even at this huge level of revenues, and assuming that the company can sustain profit margins of 50%, at a market cap of $3.25T this equates to a P/E ratio of a still-high 19x.
Bloomberg, Author’s calculations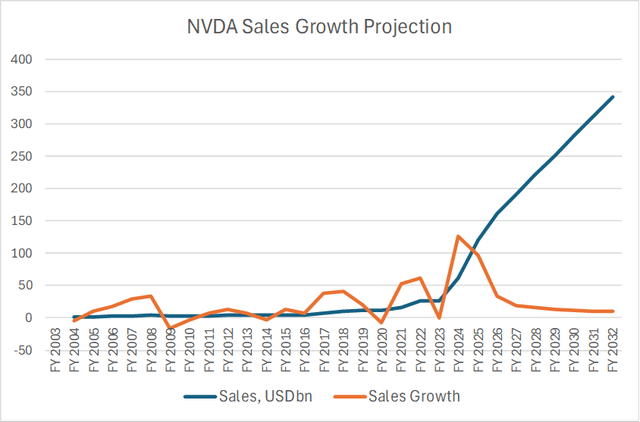
Summary
Nvidia’s stock value is now beyond extreme, with investors extrapolating recent growth long into the future despite the strong evidence that growth is a declining function of company size. Even the slightest doubts surrounding the sustainability of growth could cause investors to question why they are paying over 40x sales for an already established company, resulting in a potential stampede of selling that cuts the company’s value in half.
Read the full article here
")
")
 (OTCMKTS:DTEGY)")
")
 2024 Q3 – Results – Earnings Call Presentation (OTCMKTS:TBABF)")