 (NTPIF)")
")
")
")
 Q3 2024 Earnings Call Transcript")
")
“Common sense is seeing things as they are; and doing things as they ought to be.” – Harriet Beecher Stowe
My View of Wall Street
The pendulum swings back to the Micro from the Macro as the official start to the 2Q24 earnings season has begun. Investors have witnessed a weaker macro backdrop unfold, but it hasn’t mattered. The S&P notched its 37th record high this year, while the NASDAQ Composite has recorded 25 new highs.
Earnings and upgraded earnings revisions are the reason, and we know that typically trumps many of the “concerns.” So, the next 5-6 weeks will provide a glimpse into how companies and consumers navigate the growth slowdown. It seems we always say the same thing around earnings season.
These results will be key to whether stocks can stay elevated and perhaps build on their recent gains, OR we finally get a pullback greater than 2%.”
Consensus expectations for S&P 500 earnings are for them to climb 9.5% year-over-year in 2Q24-the fourth consecutive increase and the fastest pace since 4Q21. Despite some slowing in the economy, corporations recorded their 15th consecutive positive quarter of sales growth, rising (+4.5%) at their fastest pace since 4Q22. Let’s not forget that margins should remain above their 10-year average (10.8%) for the 14th consecutive quarter and expand to the highest level (12.4%) since 4Q21.
Margins (www.factset.com)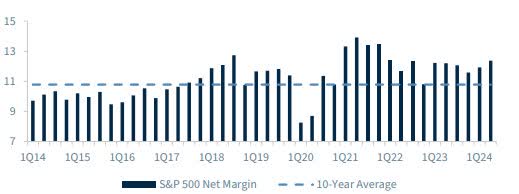
The primary reason for the solid results is the current low corporate tax structure, which keeps multinationals competitive in global markets.
More importantly, if earnings beat by even a touch, 2Q24 earnings growth could easily end up with a double-digit gain; market valuations are at the highest level since 2021, so earnings will need to be the catalyst to drive the market higher, as the current valuations have already priced in much of the good news. However, allow me to add some clarification to that statement. As noted last week, the forward PE for the S&P 500 is 21, but the PE for the median stock is 17. Investors, including myself, have a portfolio filled with a lot of “median” stocks, and if we see the market broaden out, that is where the next set of gains will be made.
Another positive is the expected broadening of the earnings picture. Seven out of the 11 sectors are expected to post positive EPS growth. Undoubtedly, EPS growth will be led by tech-related sectors, with communication services (+22% YoY) and info tech (+16% YoY) expected to deliver the best earnings growth. Megacap earnings (MAGS) are expected to slow but still should be around a 30% YoY pace. The significant difference is that the S&P 500 ex. (MAGS) will start contributing to S&P 500 earnings growth to the tune of about 6%-7%. That will come from Healthcare (XLV) and Energy (XLE) – two of my favored sectors going forward. Three heavyweights in the sector, UnitedHealth (UNH), Johnson & Johnson (JNJ), and Abbott Labs (ABT), came through with positive results.
If forecasts are anywhere near correct, this will enhance the reversion to the mean trade, broadening the market for investors.
It’s one thing for the companies to report a solid Q2. How the market reacts to said earnings is another story. Since analysts have ramped up forecasts coming into this season, it makes for a challenging setup for companies to beat their earnings forecast solidly. I expect the higher earnings bar to drive up volatility. With exuberant expectations, companies that disappoint or offer tepid guidance are apt to be punished. The S&P has had one 5% pullback this year (typically, three 4%-5% pullbacks occur in any given year), so despite all the good news on the earnings front, I wouldn’t be surprised if we get a “sell on the news” event.
Bottom line: Investors should know by now the market has a mind of its own, and nothing should be taken for granted.
Earnings
Drive Stock Prices
Earnings reports are ramping up significantly, with a total market cap of $12.3 trillion in S&P 1500 members (359 stocks) hitting the tape last week and another $21.6 trillion (555 stocks) the following week.
Alphabet (GOOGL) and Tesla (TSLA) were the first mega-caps to report on Tuesday (7/23). Alphabet posted a solid but not overwhelming quarter, while Tesla disappointed investors. Alphabet sold off on a decent report, and if that trend continues, it will be difficult for the overall market to push higher.
The next mega caps will not be for another week. Microsoft (MSFT) will release its results on Tuesday (7/30), followed by Meta (META) on Wednesday (7/31) and Apple (AAPL), and Amazon (AMZN) the day after (8/1). The following week will see a big drop off in large-cap stocks reporting, but the slate will still have a large number of stocks (over 300), including the next closest names to entering the trillion-dollar market cap club. The last of the mega caps, NVIDIA (NVDA), won’t report until late August.
The Fed
Fed Fund futures have priced in a 100% probability that the Fed will cut interest rates in September. Given that this rally has priced in that eventuality, it leaves the market very vulnerable. First, because it’s priced in, there is a good chance it will be a sell-the-news event. Secondly, if the Fed does not cut rates as anticipated, the selloff will probably be even more significant. Therefore, the probability that a rate cut in September will bring a loud cheer and positive market reaction is VERY LOW.
I’ll note that retail sales just beat consensus estimates, and while the forecasts keep bouncing around, the first read on Q2 GDP came in at 2.8%. That is the latest data; if the Fed is data-dependent, current interest rates are NOT restricting the economy.
The Trading Week
Despite the major political events of the weekend (Biden out, Harris in), the equity market seems undeterred. However, the difference in the underlying price action was notable. Monday was a reversion of the reversion, translation- it was back to Technology. MAGS suffered a decent dip in the prior week, and the “assumed” bounce occurred today. All of the major indices were higher, and the small caps rallied alongside large-cap tech for the first time in a while. The scorecard; DJIA + 0.32%, NASDAQ +1.58%, Russell 2000 +1.66%.
WTI closed back below $80 ($79.95) while the dollar was mixed.
Unlike Monday’s explosive upside session, except for the “small caps,” Tuesday was a “yawner.” The S&P 500 traded in a narrow 16-point range, closing at 5555, flat on the day. The same could be said for the NASDAQ and DJIA, but the star of the day was the small caps (IWM), adding another 1% to Monday’s gains.
Wednesday was a “Tech Wreck”. It was a poor session for all the indices, posting severe losses on the day, as the Magnificent 7 ETF (MAGS) dropped 5.5%. The S&P gapped lower at the open and faced selling pressure throughout the day, losing 2.3%. The scorecard: DJIA -1.1%, NASDAQ -3.5%, and Russell 2000 -1.6%. Healthcare was the lone bright spot, adding 0.83% during this year’s worst market session.
Given the trading action witnessed on Thursday, I had to change the tone of my routine daily updates for clients. The NASDAQ, NASDAQ 100, and the S&P all suffered breakdowns in the morning, while the Russell small caps were initially up 1%. Rallies ensued, bringing the Big Three indices back into the green. The S&P rallied to a point where it clawed back half of the prior day’s 2% loss, then sold off again, closing with a 14-point (-0.37%) loss. The NASDAQ Composite and NASDAQ 100 never recovered from their breakdown status, although their losses were pared. Meanwhile, the Russell 2000 small caps extended their gains to 1.2% at the close.
The “Sentiment” winds changed again on Friday as what was perceived as a benign PCE inflation report provided the catalyst for a buying spree. All of the indices moved higher. However, the 1.1% gain in the S&P wasn’t enough to push the index into the green for the week. It was the same for the NASDAQ Composite as both indices extended their weekly losing streaks to two.
On the flip side, the DJIA posted its fourth consecutive week of gains, while the Russell 2000 (IWM) made it three straight weeks in the green.
It is a tale of two different markets loaded with uncertainty.
The Economy
Q2 GDP grew at a 2.8% pace, much better than expected, and is up from the 1.4% in Q1. Personal consumption rose to a 2.3% pace from 1.5%, with spending on goods rising 2.5% from the prior 2.3% drop. Government consumption was up 3.1% from 1.8%.
The Fed’s favorite gauge of inflation – PCE, came in above forecast month over month, rising 0.2% vs. the 0/1% forecast. CORE PCE also remains “sticky,” reported at 2.6% yearly compared to the anticipated 2.5%. Analysts dubbed it “inconsequential.”
Inflation is waning, but it’s not “dead.” Combined with the recently reported Q2 2.8% GDP print, the case for cutting interest rates wouldn’t appear to be as crystal clear as many want to believe. The chants for rate cuts grow louder, but will they prove to be premature and incorrect? Stay Tuned.
Manufacturing
Richmond Fed’s manufacturing dropped 7 points to -17 in July, disappointing expectations, after falling 8 points to -10 in June. This is the lowest since May 2020. The index has not been in positive territory since the print in October.
Richmond Fed (www.richmondfed.org/region_communities/regional_data_analysis/surveys/manufacturing)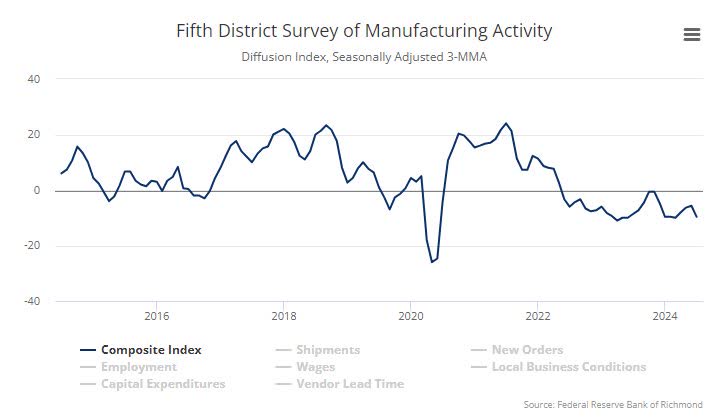
It has been in negative territory every month since May 2022, except for last September and October. Declines were broad-based.
US Flash PMI data:
Services expand, Manufacturing contracts.
Composite Output Index at 55.0 (June: 54.8). 27-month high.
Services Business Activity Index at 56.0 (June: 55.3). 28-month high.
Manufacturing Output Index(4) at 49.5 (June: 52.1). 6-month low.
Flash US Manufacturing PMI(3) at 49.5 (June: 51.6). 7-month low.
Housing
Existing home sales declined 5.4% to 3.89 million in June, below forecast and the weakest since February. This follows the 0.7% slide in May to 4.11 million in May. The month’s supply of homes rose to 4.1 after increasing to 3.7 in the prior report.
Existing Home Sales (www.nar.realtor/research-and-statistics/housing-statistics/existing-home-sales)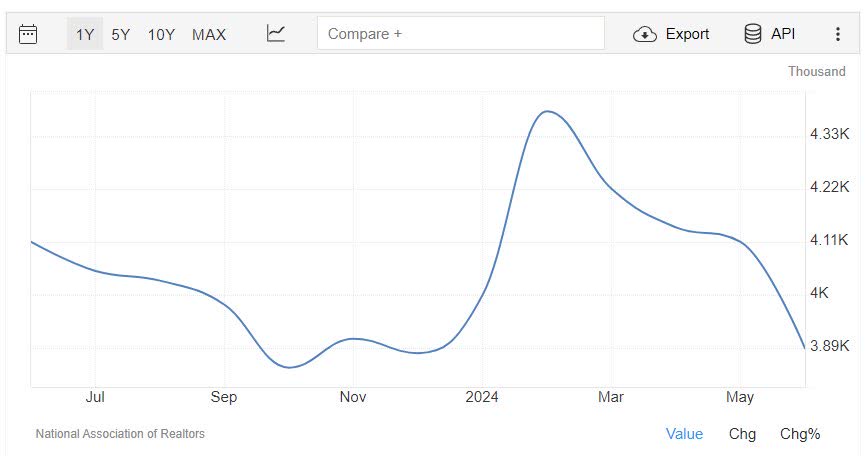
The median sales price climbed to a record high of $426,900 after rising to $417,230.
New home sales fell per June data released yesterday. Total sales volumes fell 0.6% MoM versus a 3.4% MoM gain forecast by economists. Inventories continue to rise with the highest absolute level of inventories since the post-subprime bubble unwound.
New Home Sales (www.census.gov/construction/nrs/current/index.html)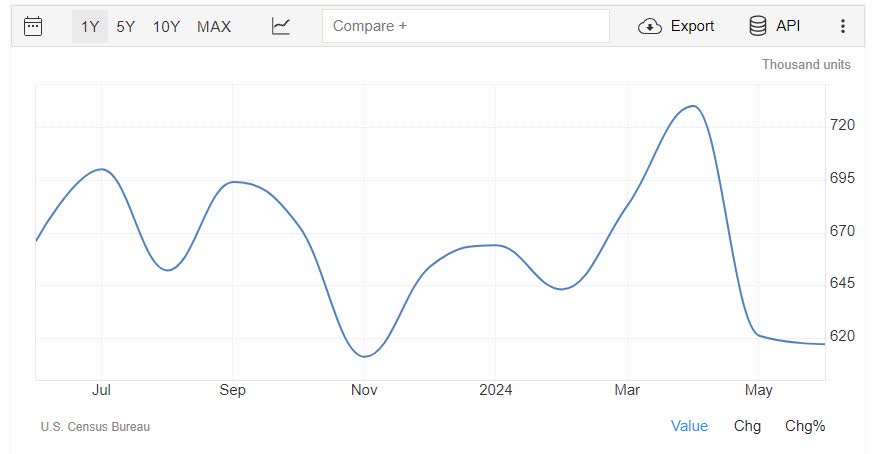
Despite rising inventory/sales ratios, the median new home spends very little time on the market, suggesting plenty of latent demand. New homes are more affordable than existing ones.
Global Scene
Flash PMIs: S&P Global released flash PMI Manufacturing data from 7 economies overnight, comprising roughly 85% of total monthly responses; results were mixed.
Global PMIs (www.bespokepremium.com)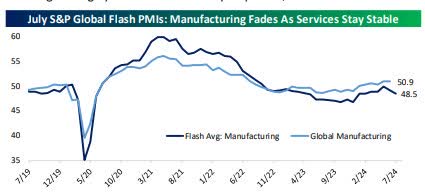
While manufacturing activity fell sharply, suggesting an end to the recent acceleration globally, services activity was more stable.
German PMI (www.bespokepremium.com)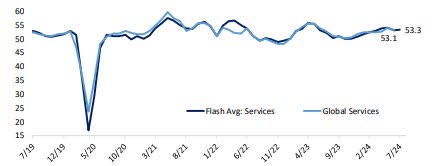
Of significance, German manufacturing PMI lagged that of the Eurozone for the 26th straight month, the worst run since at least 2008 and a strong indication of Germany’s economic underperformance over the last couple of years.
Sentiment Data from France, Germany, and the UK plunged. The INSEE surveys of French businesses showed a deterioration in sentiment.
Euro Sentiment (www.bespokepremium.com)
IFO’s survey of German firms that missed estimates showed a weaker result, and manufacturing prices plunged, as reported to the Council of British Industry.
Political Scene
In a historic move, President Biden announced Sunday that he is no longer running for reelection, though he plans to serve the remainder of his term. The president endorsed VP Harris, who is currently the presumptive Democratic candidate for president of the US.
While it is still early, VP Harris is viewed as maintaining a status quo policy platform regarding taxes, green energy investment, EV mandates, ESG, energy supply constraints, etc. In essence, Biden 2.0. This signals that the two platforms remain diametrically opposed.
Macroeconomy
This section presents a series of issues that may not necessarily impact the market today but can pose problems for the MACRO scene.
The announcement that the administration has decided to change presidential candidates adds plenty of uncertainty to the political situation. We can only hope that in the days/weeks ahead, we start to get clarity on issues. One does have to wonder if recent proposals like “rent control” will have any staying power. Hopefully, we will soon find out where presidential candidate Harris stands on the issues.
Perhaps Ms. Harris will come to realize that the plan to cap rents at 5% will do more harm than good. It will also harm affordability. The proposal comes chock full of threats to the property owners who will watch their costs rise but be forced to cap their income. If you want less of something, regulate it or tax it. Capping rents removes the incentive to BUILD and ADD more units which will accomplish the task of keeping rent under control. Study after study and common sense continue to support the notion that supply and demand rule. Cripple the landlord and the landlord has no option but to leave more properties in disrepair.
The NAHB issued an opposition to another short-sighted proposal that attacks the golden goose-the property owner.
Rent control in any form is bad for housing and the administration’s tax plan to cap rents at 5% on existing multifamily structures will worsen the housing affordability crisis by discouraging developers from building new rental housing units at a time when the nation is experiencing a shortfall of 1.5 million housing units. These rent caps would also hurt existing tenants – those that the they are trying to help – because owners and developers would be unable to cover rising costs if rents are fixed. Leading economists and numerous studies over the years agree that rent control would aggravate affordability problems by exacerbating the housing shortage in America.
“If this administration is serious about wanting to lower costs for renters, its policies should focus on increasing the rental housing supply. The best strategy to achieve this goal on the tax front is to strengthen the Low-Income Housing Tax Credit, which is the best tool to finance the production of affordable rental housing. NAHB has developed a 10-point plan to tackle the affordability crisis that calls for expanding the LIHTC, reducing regulations that stall multifamily development projects and adopting reasonable and cost-effective building codes. These common-sense solutions will boost multifamily housing production and make renting more affordable.”
Hopefully, this lame-duck proposal may never see the light of day in Congress. However, if the current administration candidate picks it up, it will bode poorly for the housing industry and help no one.
Harriet Beecher Stowe’s opening quote, “common sense,” rang true in the 1800s but is being ignored today.
Earnings
The Savvy Investor marketplace keeps all members up to date with the latest EPS results, which we use to uncover the market’s hidden gems.
The Daily chart of the S&P 500 (SPY)
This week’s market action was marked by something we haven’t seen much of this year – volatility. Breakdowns followed by intraday rallies, then late-day selloffs. That mid-week action was followed by a 1.5% rally in the S&P 500 to close out the trading week.
S&P 500 (www.freestockcharts.com)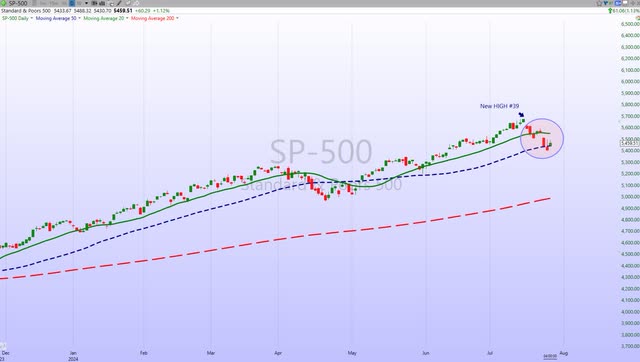
That left the S&P back above a decent support level, adding more confusion about what might come next.
Investment Backdrop
An In-depth review of the market dynamics is reserved for members of the Savvy Investor services.
THANKS to all the readers who contribute to this forum to make these articles a better experience.
These FREE articles help support the SA platform. They provide information that speaks to Both the MACRO and the short-term situation. With a diverse audience, there is no way for any author to get specific unless they’re simply highlighting ONE stock, ETF, etc. Therefore, detailed analysis, advice, and recommendations are reserved for members of my service offering on the platform.
SA verifies the information here; links are provided as supporting documentation in almost every case. If anyone can point out a comment in any article I put forth and demonstrate that it is factually INCORRECT – I will REMOVE it.
Best of Luck to Everyone!
Read the full article here
 (NTPIF)")
")
")
")
 Q3 2024 Earnings Call Transcript")
