")
")

")
")
")
Oil prices have been conspicuously quiet over the past few months despite ongoing geopolitical jitters both in the Red Sea and further into the Middle East. Bearish fears regarding the high amount of global oil supply appear to be the primary reason for such lackluster price action in both domestic WTI and global Brent crude futures. Growth fears in China don’t help the supply/demand balance as far as energy bulls are concerned, either.
All of this comes as US natural gas prices dip under the psychologically important $2 mark following a mild winter so far. Undoubtedly, weak oil and gas price trends have been headwinds for the low-P/E Energy sector.
I have a hold rating on the Vanguard Energy Index Fund ETF Shares (NYSEARCA:VDE). I very much like the fund and the level of free cash flow so many of its constituents boast, but momentum is modest, and the seasonal trend is concerning.
WTI Crude Oil Sputtering in the $70s
TradingView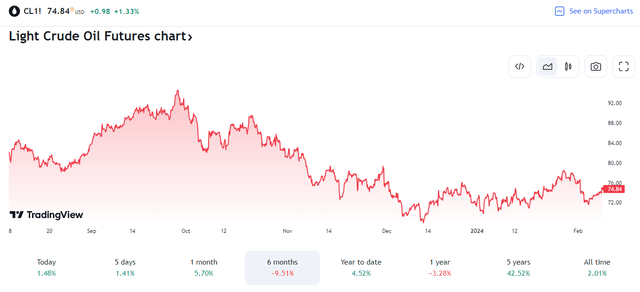
According to the issuer, VDE seeks to track the performance of a benchmark index that measures the investment return of stocks in the energy sector. It holds stocks of companies involved in the exploration and production of energy products such as oil, natural gas, and coal. The fund employs a passively managed approach, using a full-replication strategy when possible and a sampling strategy if regulatory constraints dictate.
VDE is a large ETF with about $9.5 billion in assets under management as of February 7, 2024, and it pays a high 3.4% dividend yield. Seeking Alpha’s ETF Grading system shows a lukewarm B- share-price momentum grade while its ultra-low 0.10% annual expense ratio warrants an A expense rating. Risk, however, is very high given volatile price action and a somewhat concentrated portfolio. Finally, liquidity metrics are healthy given a 90-day average trading volume of more than 600,000 shares and a 30-day median bid/ask spread of just two basis points, according to Vanguard.
Digging into the portfolio, VDE is focused on the upper-left section of the style box. The large-cap value fund, gold-rated with four stars by Morningstar, also has material exposure to both mid and small-cap stocks, enhancing its cyclical exposure. So, there is some modest style and size diversification, but with just 4% allocated to large-cap growth, I would expect VDE to continue to diverge from the performance of the S&P 500. What’s appealing, though, is that the ETF trades at less than 11 times earnings. Long-term, there is a compelling value case to be made for having an overweight to this sector which is just 3.7% of the S&P.
VDE: Portfolio & Factor Profiles
Morningstar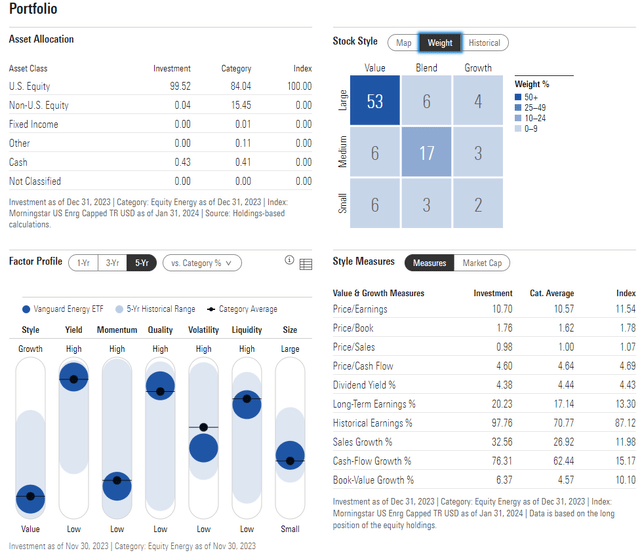
I urge investors to consider that Energy is one of the most top-heavy sectors of the market, however. VDE’s two largest positions, Exxon Mobil Corporation (XOM) and Chevron Corporation (CVX) command more than one-third of the allocation, so keeping a close watch on fundamental and technical trends with those two integrated oil & gas companies is key. Overall, the top 10 stocks comprise more than 65% of the fund.
VDE: XOM & CVX Major Positions, High Yield
Seeking Alpha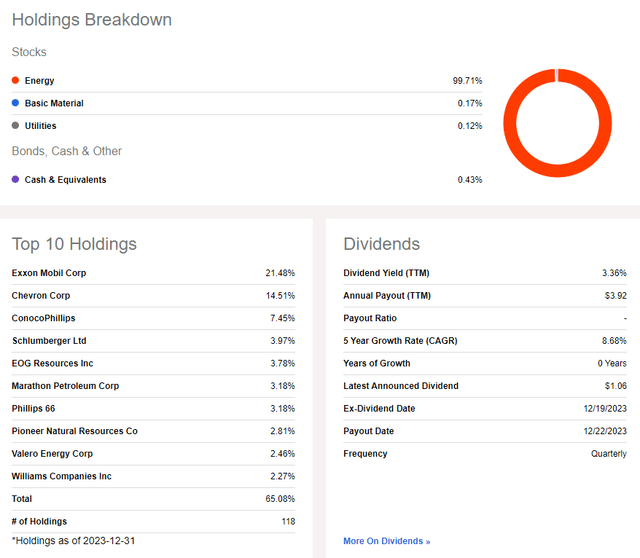
One of the most bullish longer-term factors in my view is that the Energy sector has by far the highest total shareholder yield of all 11 S&P 500 areas. Combine a 4.5% buyback yield with a 3.6% dividend yield, according to the latest J.P. Morgan Asset Management Guide to the Markets, and the total yield is more than 8%. Contrast that to the total shareholder yield of the S&P at just 3.7%.
Energy Sector: Best Total Shareholder Yield
J.P. Morgan Asset Management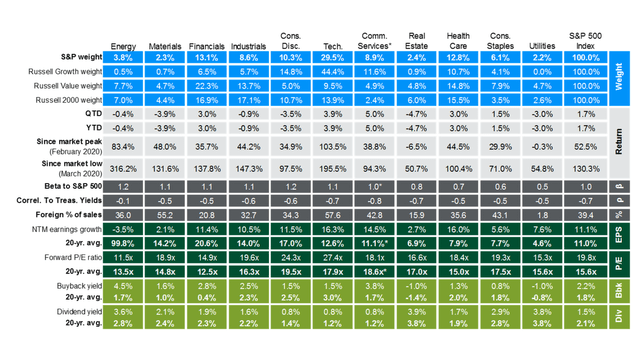
Energy Down 5% YoY
Seeking Alpha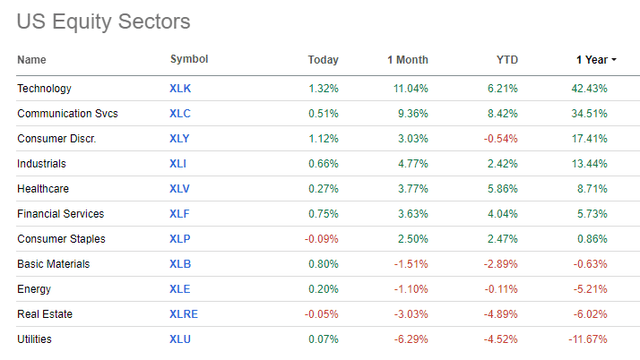
Seasonally, though, we are closing in on one of the worst months for VDE. Using Seeking Alpha’s new Seasonality feature, we see that the third month on the calendar has averaged a material 1.7% decline. April has been a great time to be long, though.
VDE Seasonality: Trouble Lurks in March
Seeking Alpha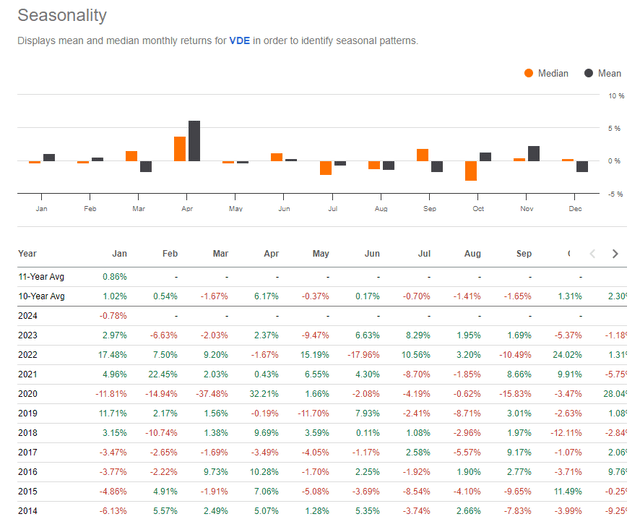
The Technical Take
With a low valuation, high total shareholder yield, a concentrated portfolio, and weak seasonal trends, the technical situation is unimpressive. Notice in the chart below that shares are stuck in a broad range between $104 and $133. This area has been an ongoing battleground between the bulls and the bears, as evidenced by the volume by price indicator on the left side of the graph. Moreover, the long-term 200-day moving average is flat in its slope, underscoring the lack of a clear trend. The shorter-term 50dma had been trending lower, but it appears to be flattening out, too.
But take a look at the RSI momentum indicator at the top of the chart – it managed to print a bullish divergence to price. That means the momentum line made a higher low while the price notched a lower low. It is thought among technicians that momentum comes before price, so that could be a bullish harbinger for future price action. Nevertheless, the way I would play it technically would be to buy on a retreat to around $105 and take profits when VDE hits $130. That range is assumed to persist until evidence shows otherwise.
Overall, it is a neutral chart while relative strength among Energy sector stocks has been weak since late 2022.
VDE: A Persistent Congestion Zone, $133 Resistance, $104 Support
StockCharts.com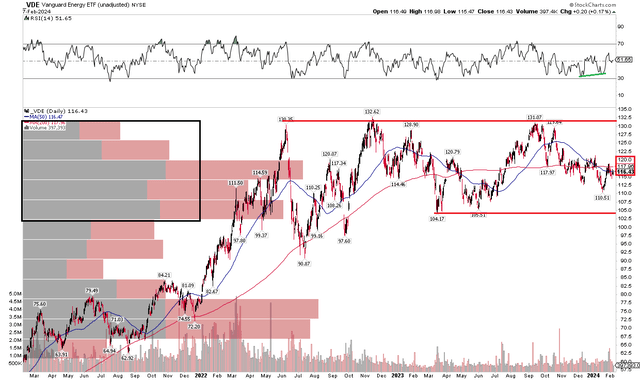
VDE: Sharp Negative Alpha to the S&P 500 Since October 2022
Seeking Alpha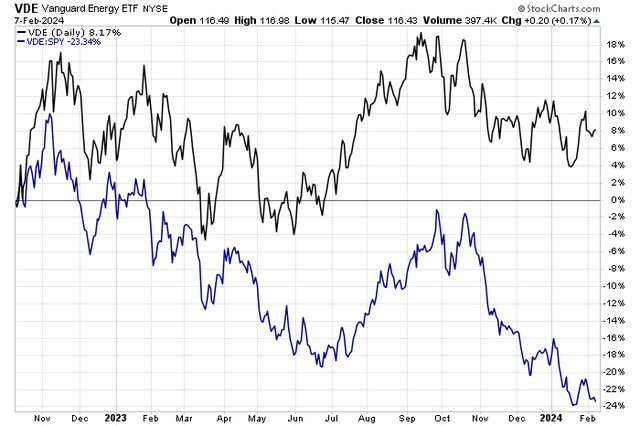
The Bottom Line
I have a hold rating on VDE. I like its valuation despite the concentrated allocation. For a buy rating to be made, however, I would like to see a further pullback to support or a breakout to new highs. What would also be encouraging is to see oil and gas prices break out from generally bearish price action over the last handful of months.
Read the full article here
")
")
")
")
")
")