


")


The purpose of my Seeking Alpha article, The 60/40 Portfolio Is A Risky Investment, on June 11, 2017, was to point to the high correlation of this strategic allocation with the stock market and to the fact that past returns have offered a false sense of security to investors. Most readers received the article well, but there was also some backlash and denial of reality.
In 2022, my fears were confirmed, as the correlation between stocks and bonds turned positive and 60/40 portfolios delivered large losses depending on the bond duration mix. It appeared to me back in 2017, but also now, that most investors think there are only two possibilities: a high positive correlation between stocks and bonds, as in the 1990s, or a high negative correlation, as in the early 2000s and early 2010s, and in both cases, the portfolio would gain. However, there was a confounder: falling bond yields. As soon as the confounder was eliminated due to high inflation and rising rates, the 60/40 portfolio crashed.
24-month correlation of S&P 500 index and S&P US Treasury Bond Total Return (Price Action Lab Blog. Norgate Data)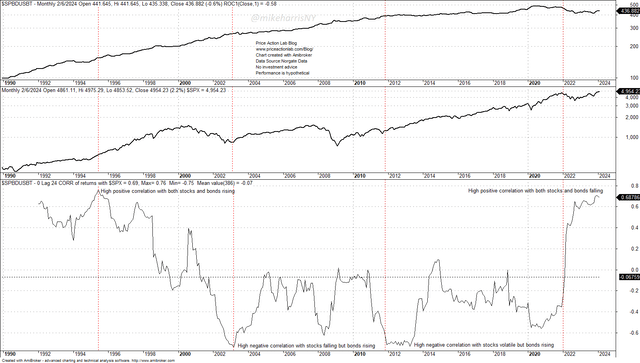
The correlation chart above shows that since 1990, there have been four different regimes of stock-bond correlation and performance:
- High positive correlation with both stocks and bonds rising in the mid-1990s.
- High negative correlation with stocks falling but bonds rising during the dot-com bear market.
- High negative correlation with stocks being volatile but bonds rising due to the early 2010s quantitative easing period.
- High positive correlation with both stocks and bonds falling during the 2022 inflation period.
The fourth possibility appeared to have a low probability for most investors in the 60/40 portfolio. However, even if the probability of an adverse event is low, given enough time, it will occur, and it did occur.
Performance of 60/40 portfolio in SPY and TLT ETFs (Price Action Lab Blog. Norgate Data)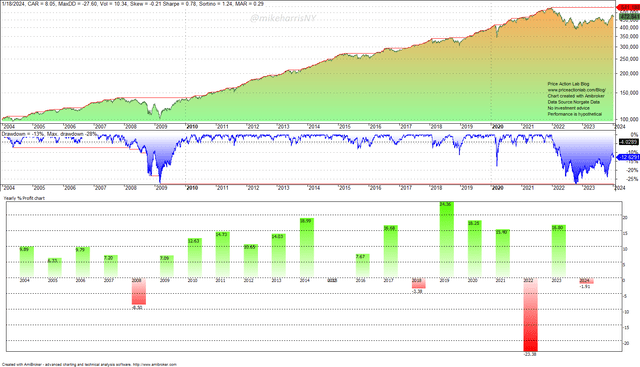
The 60/40 portfolio in SPY and TLT ETFs plunged a little more than 23% in 2022 due to #4 above. Portfolios with lower-duration bond ETFs fell less. Given that before 2002 the largest loss was 8.5% in 2008, a 23.4% loss was a shock to investors. Can it happen again? In the quant space, some of us have a heuristic: the future worst annual loss and drawdown could be double. Therefore, it will not be a surprise to see annual losses and a drawdown in the order of 50%.
Are there better strategic allocations than the 60/40 portfolio?
Investors should be careful about promises of strategic allocations that, in backtests, have delivered solid risk-adjusted returns; most of those are curve-fitted to historical data. The curve-fitting suffers from the following biases:
- Post-hoc selection of assets.
- Optimizing the weights of the portfolio assets.
Nowadays, with the availability of backtesting programs and even artificial intelligence, it is easy to optimize strategic allocations to eliminate the large losses in 2022, for example. However, there seems to be a problem that may offer a heuristic for identifying optimized strategic, but also tactical, allocations: when the 2022 losses are minimized or even eliminated, 2008 losses emerge or increase.
Let us look at two examples. First, the well-known All Seasons Portfolio. This is a portfolio with 40% in TLT, 15% in IEF, 30% in VTI, and 7.5% in IAU and DBC ETFs. It sounds like a cool allocation.
Performance of All Seasons Portfolio (Price Action Lab Blog. Norgate Data)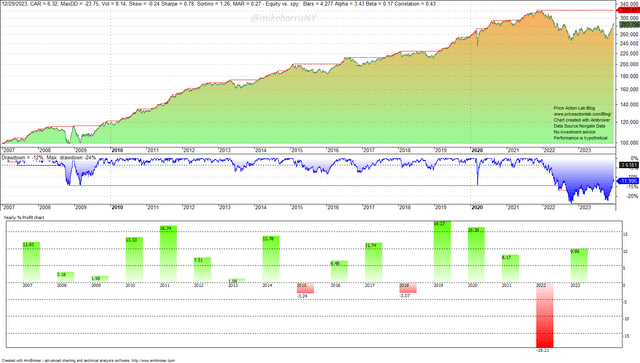
Everything was going smoothly until the end of 2021. Someone could even leverage this portfolio for some serious alpha since the largest annual loss was 3.3% and the maximum drawdown was around 15%. But then, in 2022, a tail even occurred: the portfolio plunged more than 19%! What happened?
One may easily figure out that this portfolio has a large allocation to fixed income, 45% in total. It was natural that the portfolio was hit with a large loss, and the maximum drawdown increased from 15% to 24%. Notice that in 2008, the portfolio gained 3.2%, and that was an attractive feature before 2022.
In hindsight, someone might have realized that the bond allocation was too large and adjusted it as follows: 20% in each of the SPY, AGG, GLD, DBC, and IYT ETFs.
Over-fitted portfolio allocation (Price Action Lab Blog. Norgate Data)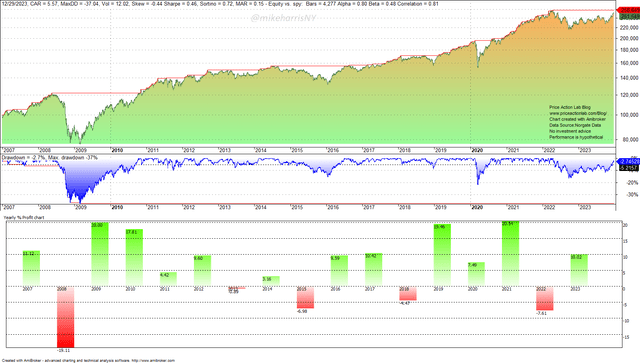
As shown in the backtest above, the 2022 loss falls in the “comfort zone” below 10%, but the 2008 loss increases to 19.1%, and the drawdown surges to 37%. This “innocent”-looking allocation is curve-fitted in hindsight. The heuristic about the 2008-2022 trade-off works well in this case.
In the case of other strategic allocations, the curve-fitting may not be as evident as in this case. There is a problem with portfolio research and, in general, with quantitative analysis: the objective should be to minimize Type-I errors (false positives), but the drive for profit pushes developers to ignore this rule and optimize.
Conclusion
Investors should be careful when they read reports about a new strategic allocation solution that looks solid in backtests; there is no free lunch in a post-quantitative easing world, and the pressure to reduce deficits, which in the past have fueled easy money, could be a regime change. The era of simple, “do nothing” strategic investing that guaranteed future income may be coming to an end, with tactical investing being the only alternative left other than buy and hold, with all its problems and potential losses from the possible use of unprofitable timing methods.
Read the full article here

")

")
")
")