
")


")

The rate-cutting process is set to begin and will lead to a steeper yield curve. More importantly, it signals the end of the “higher for longer” trade that has driven the NASDAQ 100 (NDX) and the S&P 500 (SP500) to record highs.
Powell’s Jackson Hole speech didn’t have any hidden surprises. More importantly, it permits the bond market to steepen the yield curve as the 2-year rate (US2Y) falls to the 10-year rate (US10Y). The yield curve has served as an indicator for the higher-for-longer trade.
Powell’s shift from inflation to the labor market is due to the rising unemployment rate over the past few months. Powell noted:
“The upside risks to inflation have diminished. And the downside risks to employment have increased.”
Sahm Rule
At this point, that is key. It is clear the Fed has concerns about the recent cooling of the job market and the better balance that has been struck with the slowing of the payroll hiring pace and the fewer job openings. However, the more concerning feature is that the Sahm rule was triggered following the July employment report, and it has a perfect record for predicting a recession.
Bloomberg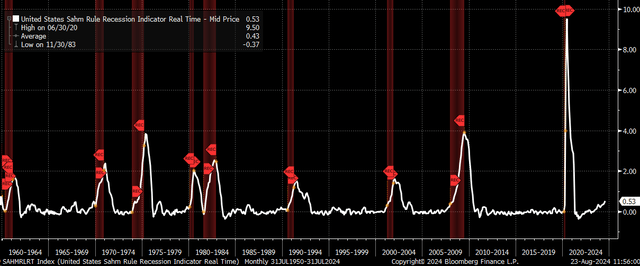
The July employment report triggered the Sahm rule, and the bond market immediately took notice, with the yield curve steepening. At this point, the 2/10 curve has technically broken out, and it has successfully retested that breakout over the past few days. Technical analysis would suggest the yield curve is heading much higher than current levels.
TradingView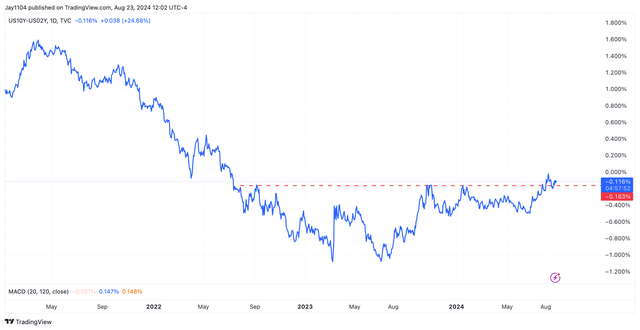
Most of that will come in the form of the 2-year rate falling as the market prices in rate cuts. The 2-year rate is 82 bps higher than the 24-month Generic Fed Fund Futures rate of 3.1%. Historically, that spread generally closes over time, and part of that can be because the Fed Funds Futures pricing changes, but most of it is also because the 2-year rate falls. The spread looks historically wide right now, but it will likely close at this point in the cycle as the 2-year rate falls. To reach parity, the 2-year would need to fall to 3.1%, based on Fed Fund Futures pricing.
Bloomberg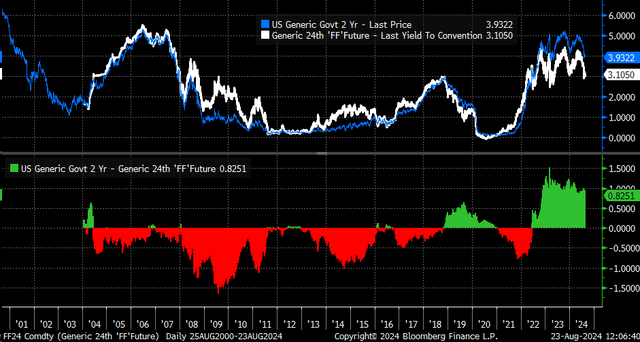
The Higher For Longer Trade
As the curve steepens ahead of a rate-cutting cycle, it also means that the higher-for-long trade is over. The trade where investors have been hiding out in large-cap growth stocks will struggle as money rotates out of growth stocks and back into Treasuries because the rout in Treasuries for now is over.
It may not be as visible when looking at the price of the NASDAQ 100 versus the 10-2 curve, but it is visible when looking at the NASDAQ 100 earnings yield and comparing it to the 10/2 curve. It clearly shows that since March 2023, the earnings yield of the NASDAQ 100 has been trading alongside the 10/2 curve. This would seem to suggest that as the yield curve steepens, the earning yield of the NASDAQ 100 should rise.
Bloomberg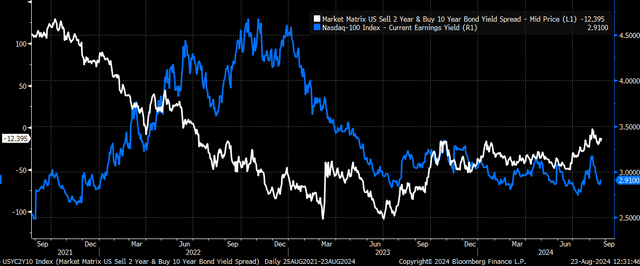
Further, the interest rate spreads between global and US bonds are now contracting, and that is having far-reaching effects across the FX complex. This is also helping to strengthen the Japanese yen vs. the US dollar (USD:JPY), which will further impact the unwind of the carry trade, which has already been in the process of unwinding over the last few weeks.
Bloomberg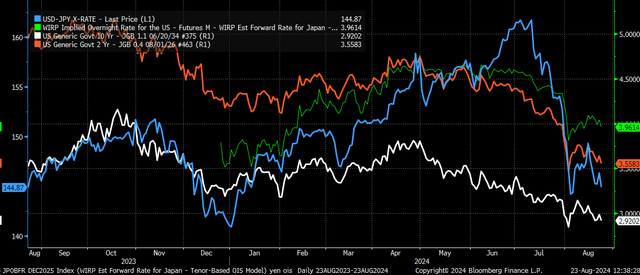
Of course, the two go hand in hand with the higher-for-long trade because, in the end, the wide interest rate spreads provided the financing for the higher-for-long trade. The yield curve appears to be telling us that the time for the higher-for-long trade is over now that the Fed rate-cutting process is about to begin.
Join Reading The Markets
Reading the Markets helps readers cut through all the noise, delivering daily video and written market commentaries to prepare you for upcoming events.
We use a repeated and detailed process of watching the fundamental trends, technical charts, and options trading data. The process helps isolate and determine where a stock, sector, or market may be heading over various time frames.

Read the full article here

")


")
