")


")


Introduction
Invesco S&P SmallCap 600 Revenue ETF (NYSEARCA:RWJ) is an exchange-traded fund that invests in accord with its chosen benchmark, the S&P SmallCap 600 Revenue-Weighted Index. The index is constructed by weighting the constituents of the S&P SmallCap 600 by their revenues. RWJ charges an expense ratio of 0.39%, per Invesco, with assets of $1.57 billion as of August 16, 2024. The fund had 598 holdings. It is notable that the fund has a reported median bid/ask spread of 0.18%, however, which is high; we will factor this into our valuation later, as it is a day-one cost to the investor.
I last covered RWJ in December 2022, at which point we had just had a terrible year for equities. Having said that, RWJ had held up relatively well; it was down about -10% through the year, but comparatively this was not too bad for 2022, in which the Nasdaq-100 U.S. equity index fell by about a third. At this time, in early December 2022, I thought the forward five-year IRR potential was in the region of over 12%. Since then, the total return (per Seeking Alpha data) has been 16.40%; however, this compares to a change in the S&P 500 index of 37.08%. Annualizing the 16.40% return, it comes to about 9.31% per annum.
My projection was directionally correct, only a few percentage points out. However, one would think with IRR potential of some 12% or so at the time, some out-performance might have been found. The fact is, mega-cap stocks (which were hurt heavily through 2022) bounced back aggressively. It makes sense to revisit the revenue-weighted small-cap fund, RWJ, to see how things look in 2024, in which both the equity and macro environment are both remarkably benign in the face of geopolitical uncertainties.
Portfolio
The existing RWJ portfolio, with its 598 holdings as mentioned earlier, is well-diversified. That is, not just by number but by concentration, with the top 10 holdings representing just under 20% of the fund.
Data from Invesco.com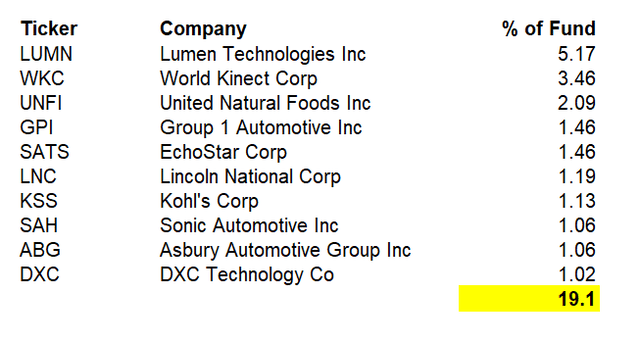
At the portfolio level, the key sector exposures are driven by Consumer Cyclical (at 23.35%), Industrials (15.42%), Financial Services (11.27%), and Technology (10.51%). The fund is actually rather well diversified across sectors, too, but with an overall bias toward cyclicality and economic sensitivity.
Morningstar.com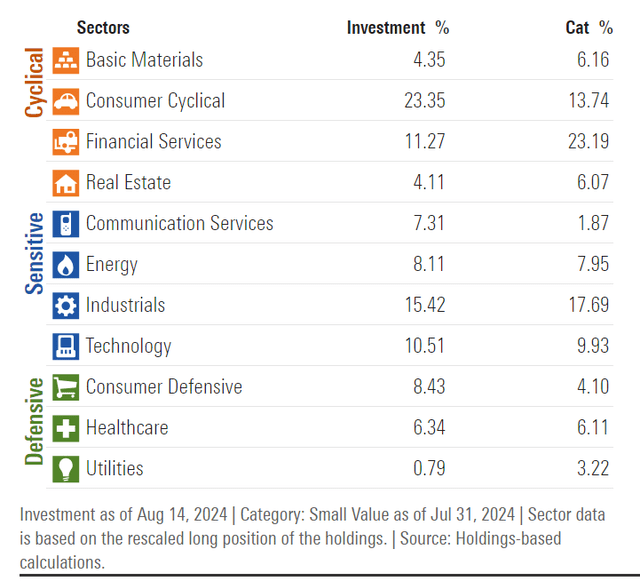
The structure of the portfolio might therefore lend to some economic and market beta, but with the current positioning of the U.S. economy, this is not necessarily a favorable position. See for example the chart below from Fidelity, which estimates the current position of the U.S. economy in the “business cycle”, based on moderating growth, tighter credit, slowing earnings growth, relatively strict monetary policy (still, although a rate cut in September 2024 is on the cards), and worsening inventory/sales ratios.
Fidelity.com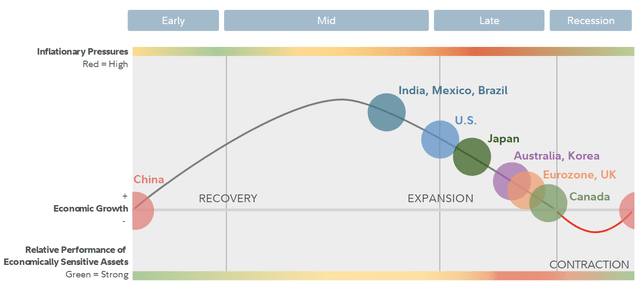
Having said that, the U.S. economy has been remarkably strong in recent times, and seems to have averted an outright recession. Therefore, in a scenario of continued relative stability (i.e., absent a crash for presently unforeseen reasons), RWJ could conceivably continue to chug along and generate earnings at its albeit somewhat mediocre return on equity level. The return on equity, among other factors, we will revisit in the next section.
Valuation
Unfortunately, the most recent fact sheet for RWJ’s earlier-cited benchmark, the S&P SmallCap 600 Revenue-Weighted Index, does not indicate substantial financial data in terms of consensus expectations. Nevertheless, Invesco themselves provide trailing and forward price/earnings ratios of 15.11x and 13.62x, respectively, with a price/book ratio of 1.25x, as well as an indicative dividend yield of 1.25% on a twelve-month basis (these figures as of August 16, 2024). These figures imply forward one-year EPS growth of 10.94%, with a forward return on equity of 9.18%.
Morningstar meanwhile think three- to five-year earnings growth will come in at 11.33%, but I would prefer not to anticipate on an acceleration in earnings growth. Instead, I will assume a maturing growth rate from 10.94% in year one, followed by a slowly declining rate to 5% in year six (our terminal year). This results in a roughly albeit slightly declining return on equity (from 9.18% to 8.62%). This still results in a fairly strong and stable EPS growth rate of over 9% over the first three years. Holding dividend rates constant, and assuming no material share buybacks, the IRR potential is actually quite good, at over 12% per annum.
Author’s Calculations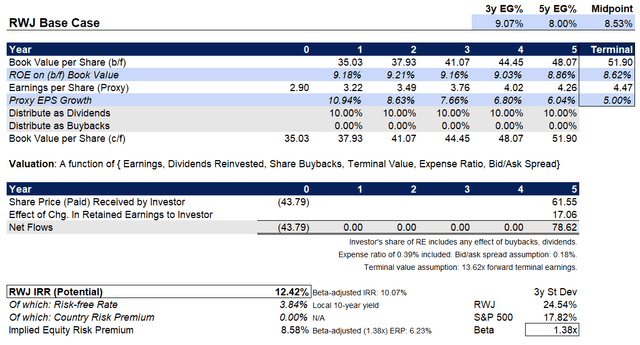
However, notice (as included in the bottom-right of the chart above) the beta of the fund is quite high, at 1.38x vs. the S&P 500. This breaks down into upside beta of 1.57x and downside beta of 1.20x. Therefore, in a benign and bullish environment, RWJ has the potential to bounce and out-perform the S&P 500, but in a bearish environment, RWJ is more likely to under-perform. Nevertheless, there is some positive skewness here, and I have already covered mega-cap funds recently, and have taken a bullish bias. Therefore, I would have to deduce that RWJ does seem to have some out-performance potential at present; thus a bullish bias is warranted.
Macroeconomic risks are still relevant, though. If the U.S. economy is positioned such that it is characterized by “late-stage” economic markers, and given that markets tend to lead the economy by 6-18 months or so on average, there is certainly a possibility for RWJ to take a turn for the worse should the markets anticipate on a slowdown. The underlying return on equity of RWJ’s portfolio is not especially strong as compared to mega-cap, more profitable portfolios. This means a downturn could more easily throw the fund’s near-term earnings stream off; hence, the price/book ratio is low for RWJ at just 1.25x (as referenced earlier).
On a more positive note (with respect to the low price/book ratio phenomenon): the investor is only paying a 25% premium above RWJ’s “weighted-average balance sheet”; the relative cheapness and higher level of diversification provides some downside support. This may well be why RWJ actually out-performed mega-cap stocks through 2022.
In summary, RWJ seems undervalued, with a beta-adjusted equity risk premium of over 6%, and a headline IRR potential above 12%. However, risks remain, and RWJ continues to run the risk of behaving in a more volatile fashion than large- and mega-cap ETFs. This could play into the hands of RWJ investors, but an ill-timed investment could easily spell relative under-performance.
Read the full article here
")

")


