QQQ ETF: Risk premium has subsided
I previously covered the Invesco QQQ Trust ETF (NASDAQ:QQQ) about a month ago, on July 18, 2024. That article is entitled “QQQ: You Need To Look At This Chart.” The chart I was referring to was a chart showing the risk premium of QQQ relative to other assets (such as value stocks and treasury rates). At that time, I was concerned by QQQ’s high-risk premium. Quote:
Judging by the yield spread, QQQ’s valuation premium over value stocks is among the highest levels in two decades. The spread between the dividend yield of QQQ and the 10-year Treasury rates is also among the thinnest levels in at least two decades, indicating QQQ’s valuation risks relative to risk-free rates.
Since then, the macroeconomic conditions have changed materially. The two top changes in my mind include the release of new PPI data (Producer Price Index) by the U.S. Bureau of Labor Statistics and changes in Treasury rates. These data suggest to me that a soft landing scenario has become much more likely than at the time of my last writing (more on this later). These changes have led me to see a reduced risk premium from QQQ and a more encouraging return/risk profile ahead.
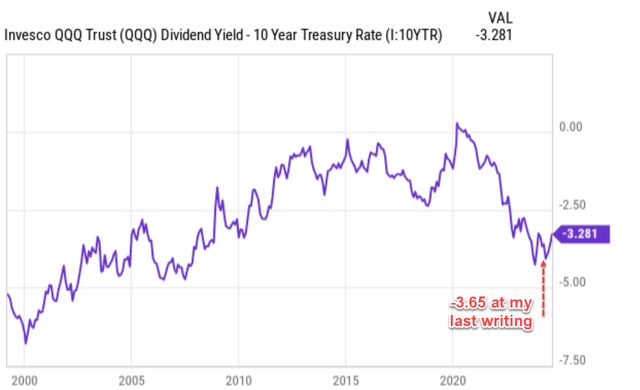
In the rest of this article, I will detail the impacts of these changes on QQQ’s return/risk profile. I will start with the reduction in the risk premium. As mentioned in my earlier article, the yield spread between QQQ and risk-free rates (represented by the 10-year Treasury rates) was among the thinnest levels in at least two decades. It’s admittedly still very thin by historical standards, as you can see from the chart below. However, compared to the spread at my last writing, the current spread has increased to -3.28%, noticeably wider than the earlier figure, indicating a lower risk premium.
Next, I will explain why I expect the risk premium to lower further.
Seeking Alpha
QQQ ETF: Basic facts
Before further diving in, let me quickly introduce the fund and point out a features relevant to the rest of the discussion. QQQ is based on the NASDAQ 100 index. To my knowledge, it’s the largest and most actively traded ETFs in this space. A few features that even experienced investors tend to overlook are quoted from the fund description below (the emphases were added by me):
QQQ has huge tech exposure, but it is not a “tech fund” in the pure sense either. The fund’s arcane weighting rules further distance it from anything close to plain vanilla large-cap or pure-play tech coverage. The ETF is much more concentrated in its top holdings and is more volatile than our vanilla large-cap benchmark. Still, the fund has huge name recognition for the underlying index, the Nasdaq-100. In all, QQQ delivers a quirky but wildly popular mash-up of tech, growth, and large-cap exposure. The fund and index are rebalanced quarterly and reconstituted annually.
QQQ is currently priced at an average P/E ratio of 35.09x and a P/B ratio of 7.86x according to the following data provided by ETF.com. These multiples are admittedly not cheap by any standards. However, I will explain why I see a favorable return/risk profile despite such elevated multiples.

Source: ETF.com
QQQ ETF: I see improved odds for a soft-landing
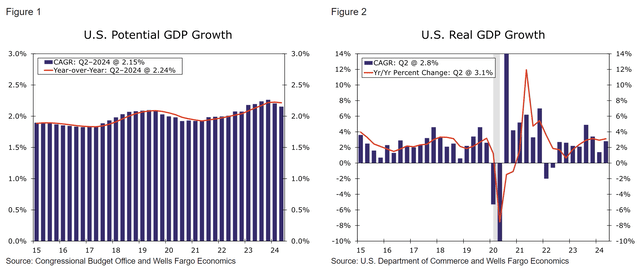
As mentioned upfront, I see improved odds for soft lading based on recent U.S. inflation data, PPI data, and also GDP growth data. Recent data has shown a consistent decline in the CPI, suggesting that inflationary pressures are easing. PPI data also show that U.S. producer prices have risen less than expected in July 2024. A cooling PPI indicates that costs for businesses are decreasing, which can eventually feedback and further lower consumer prices. In the meantime, U.S. real GDP has been growing at a healthy rate (a 3.1% YOY growth in Q2) as seen from the following chart.
Wells Fargo
Of course, a soft landing would better support the valuation multiples, and thus the return potential, of a wide range of funds, not only QQQ. However, my investment experiences have taught me that lower interest rates and expansionary environments would benefit tech-oriented stocks more than other sectors. Recent comments made by Wells Fargo’s head of global investment strategy, Paul Christopher, summed up the underlying dynamics quite well. Quote (and the emphases were again added by me):
Stocks are poised for a run-up that hasn’t been seen in three decades, says Paul Christopher. That’s because inflation is declining and the economy “is not collapsing,” he said. The Federal Reserve “is in a good position here if they can be proactive enough,” Christopher told CNBC on Thursday, suggesting that central bankers would issue a 50 basis point rate cut in September followed by a “couple more” rate cuts through the end of the year. “We’ve still got a good chance to soft-land this economy,” he added. Christopher said lower short-term interest rates would most likely benefit financial and tech stocks as financial institutions gain more in deposits while tech firms’ earnings improve. Those two trends are “exactly what happened in 1995,” he said.
His above comments are well reasoned, in my view, consistent with my analysis of historical patterns, and also aligned with the interest rates outlook indicated by federal funds’ futures contracts as detailed next.
QQQ ETF: I expect risk premium to further subdue by 2024
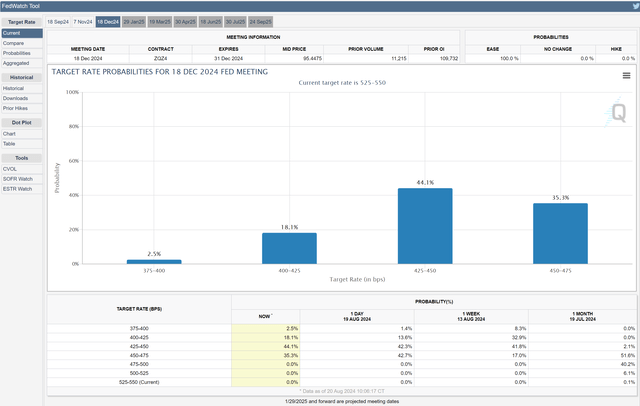
Thanks to the new data mentioned above, the outlook for interest cuts has drastically shifted since my last writing. More specifically, the CME Group FedWatch Tool below compares the current expected probability for interest cuts by 2024 to that from a month ago. As seen, the current expectation points to at least two cuts totaling 50 basis points by the end of this year. In contrast, as recently as one month ago, the market still expects a 46%-plus probability for one cut or no cut. If multiple rate cuts do materialize as the data suggest, I expect the return/risk profile for QQQ to further brighten.
CME group
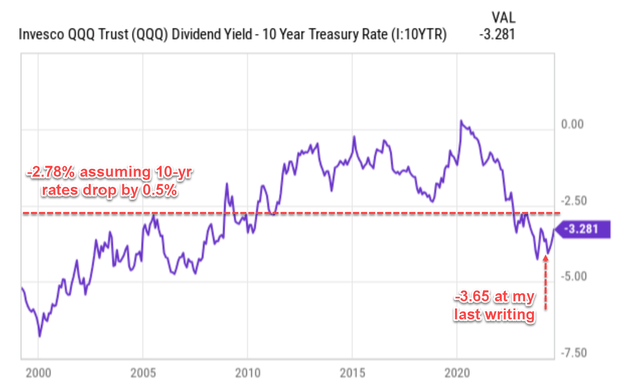
As an example, at QQQ’s current price, the yield spread relative to 10-year Treasury rates would further widen to be at least -2.78% by the end of the year, assuming that 10-year Treasury rates decline in tandem with short-term rates. As seen in the next chart below, such a spread begins to approach the historical average level.
Seeking Alpha
Other risks and final thoughts
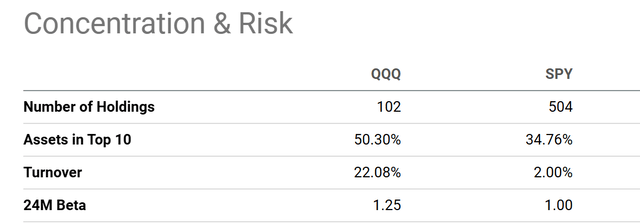
In terms of downside risks, QQQ is exposed to essentially the same set of risks common to other large-cap indexed funds. Here I will just point out a few of QQQ’s peculiarities. The chart below compares the risks QQQ and SPY used to represent the broader market. As seen, QQQ has a much higher concentration risk due to its indexing method and lower number of holdings. It has 50.30% of its assets invested in the top 10 holdings compared to 34.76% for SPY. QQQ also has a higher turnover rate, at 22.08%, compared to 2.00% for SPY. This could mean heavier tax headwinds. Finally, QQQ has a higher beta, at 1.25, compared to 1.00 for SPY. Looking ahead, I expect the volatility to even heighten in the next few months given the ongoing geopolitical conflicts, the ongoing U.S. presidential election, and the different proposed policies from the presidential candidate.
All told, I expect the dominating forces to be interest rates and real GDP growth rates. Judging by the data released since my last writing, I see much higher odds for a soft landing with lower interest rates and steady GDP growth. I expect these conditions to be especially beneficial to tech-oriented funds like QQQ.
Seeking Alpha
Read the full article here


