


Back in January of 2019, I wrote about an observation that suggested when the 2-year Treasury yield would be more than 1% below the effective Fed Funds Rate, there would be a subsequent collapse in the Fed Funds Rate as well as a recession. I advised to keep an eye on that metric.
While in 2019, the difference never reached 1% before the Fed would start cutting rates in August of that year, the gap peaked at about .65% in the middle of July.
It was a good metric to watch that helped give a heads up to both a recession and lower rates to come. Covid lock downs in March of 2020 completely exacerbated the entire metric and the Fed would go on to lower rates to 0% all the way until June of 2022.
Fed Funds Rate Vs. 2-Year Treasury
Here is a long term chart going back to 1985 comparing the 2-year Treasury yield to the Fed Funds Effective Rate:
Fed Funds Rate Vs. 2-Year Treasury (St. Louis Fed (FRED))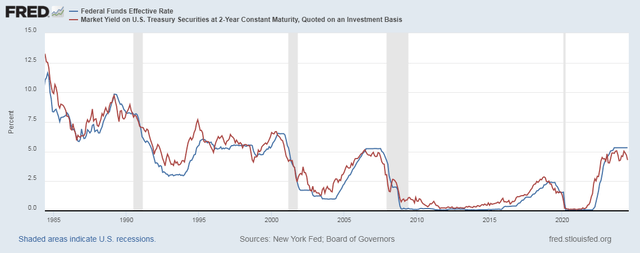
The 2-year Treasury yield tends to follow closely the Fed Funds Rate. The key factor is when the market senses a recession, the 2-year Treasury yield will drop and drop before the Fed decides to cut rates.
Now here is a chart going back to 1982 showing the difference between the Fed Funds rate and the 2-year Treasury yield. Note that these charts are monthly and so they are the average for the month.
Fed Funds Rate – 2-Year Treasury Yield (St. Louis Fed (FRED))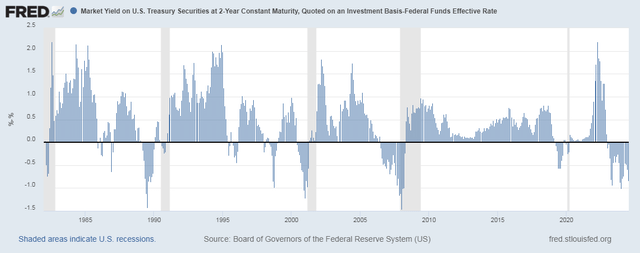
There are 3 instances I want to take note of in the past when the difference of the Fed Funds Rate would be over 1% of the 2-year Treasury rate.
July 89′ – 1.42%
January 01′ – 1.22%
January 08′ – 1.46%
In each of these instances, what followed was a large leg down in interest rates and a recession as well.
My observation of this in January of 2019 was that there would be another gap coming and if it were to get to 1%, it would spell both a recession and a large drop in interest rates. A that time, both yields were about the same. By July, as the 2-year Treasury yield would keep falling, the gap became as low as .65%. By August, the Fed would start cutting rates again sensing a slowing economy.
Here is a close up chart of both Rates during 2019:
Fed Funds Rate – 2-Year Treasury 2019 (St. Louis Fed (FRED))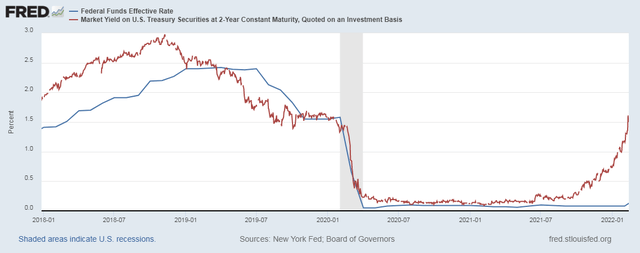
Lock down measures were announced in March of 2020 for Covid and the Fed cut rates to 0% and kept them there until about June of 2022.
2024 Observations
Here is a chart of both the Fed Funds Rate and the 2-year Treasury Yield:
2024 Fed Funds Rate Vs. 2-Year Treasury Yield (St. Louis Fed (FRED))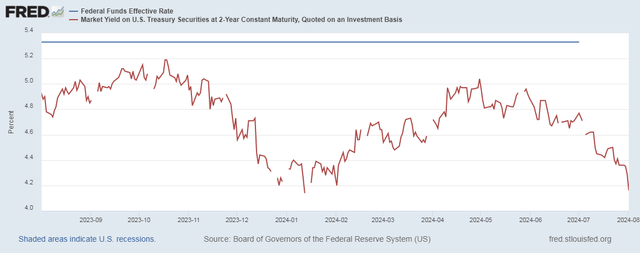
Below is a chart showing the difference between the two:
2024 Fed Funds Rate – 2-Year Treasury Yield (St. Louis Fed (FRED))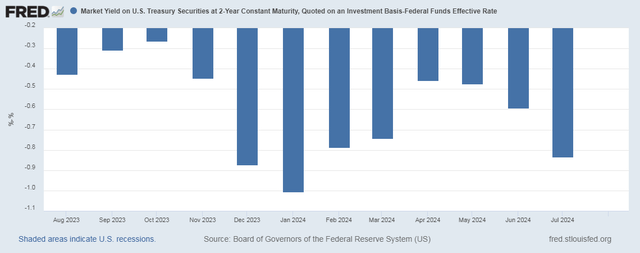
In January of 2024, the average difference was 1.00% and that was a close call for being an omen for a recession and another down leg in interest rates. The gap shrank by April when the 2-year Treasury would average 5.04% in that month.
Today’s GAP: 1.46%
Today’s Effective Fed Funds Rate is 5.33% and the Yield in the 2-year Treasury closed at 3.87% making the difference a staggering 1.46%.
The average gap in January of 2008 was 1.46%, and what followed was the great recession and the requirement to bailout banks.
Conclusion
The charts above speak for themselves. I’ve noted the specific months when the gap would be over 1% and at what percent the peak would be for the months average. What always followed was both a large leg down in interest rates and a recession.
There is good reason to believe that we will once again being entering into a recession and that interest rates will fall once more.
Inflation is sure to fall simply on account of falling demand from the recession and a reduction in interest rates will be a deflationary force as well.
Lowering rates and dealing with a recession is like turning a very large boat so these actions will be a theme for the next year or two.
Read the full article here


")
")