


")

")
Investment thesis
Nextracker Inc. (NASDAQ:NXT) is a market leader in providing solar tracking solutions in the growing solar power generation sector. Since its IPO in 2023, it has delivered double-digit returns. Its low fixed cost structure meant that as revenue grows, there would be larger profits leading to better returns.
The company is financially sound and is a better performer than its peers. At the same time, there is more than a 30% margin of safety at the current market price. This is an investment opportunity.
Background
IPOed in 2023, the company described itself as “a global leader in advanced solar tracker technology, providing intelligent, integrated solutions for utility-scale and distributed generation solar projects worldwide.”
“It generates revenue from the sale of solar trackers and from licensing its software product. Its most significant source of revenue is the sale of solar tracking products.”
The purpose of its products is to enable solar panels to track the sun’s movement to maximize energy production as well as optimize power plant performance. The revenue growth potential of Nextracker is then tied to the growth of the solar generation sector.
The solar power generation sector appears to be a double-digit growth one over the next few years as illustrated by the following:
“The global solar energy market size…in 2019 is forecasted to reach…by 2027 at a CAGR of 13.6%…” Emergen
Based on the medium scenario by Solar Power Europe (as shown in Chart 1), the demand for solar power in gigawatts is projected to grow at 21% CAGR from 2022 to 2027.
Chart 1: WORLD ANNUAL SOLAR PV MARKET SCENARIOS 2023 – 2027 (Solar Power Europe)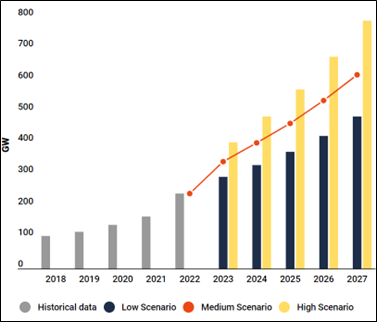
If nothing else, the market reports suggest a double-digit growth runway for Nextracker.
In its 2024 Form 10k, the company claimed that it is the global market leader based on the gigawatts shipped for 8 consecutive years. It would be a shame if the company is not able to build on this to deliver good growth. This is especially since:
- “The company has developed the next generation of solar trackers that enable rows to move independently, providing further benefits to customers…”
- “Today’s utility-scale solar plants have evolved from fixed-tilt systems to generally rely on solar tracking technologies that increase electricity generation and improve economics for plant owners…”
Operating trends
According to the company, before the IPO, there were “no stand-alone separate historical financial statements.” Accordingly, the pre-IPO consolidated financial statements are “pro forma-based.”
Nevertheless, looking at the performance since 2020 provides a picture of the trends and can point to what can be achieved in the future.
From 2020 to 2024 revenue grew steadily at 20.9%. Refer to the left part of Chart 2.
Note: The company has March as its financial year-end. In this article, the year refers to the financial year.
On the other hand, PAT declined from 2020 to 2022 before recovering. The profit decline was due to higher freight costs while the recovery in 2023 was because of increased pricing. This is illustrated by the gross profit margin trend as shown in the right part of Chart 2.
You can see that the gross profit margin trend is reflected in the contribution margin trend as shown in the left part of Chart 2.
Note that in my business and valuation model, the IRA credit amounting to USD 121 million in 2024 was excluded from the cost of sales. This meant that the gross profit margin and contribution margin as shown in the charts are not skewed by the tax credits.
The other feature of Nextracker is the low fixed cost as shown in the left part of Chart 2. In 2020, the fixed cost was about 8% of the total cost (fixed + variable). This increased to 11% in 2024.
Part of the reason for this was the increase in the Selling, General, and Administration (SGA) margin as shown in the right part of Chart 2. This low fixed cost meant that as volume ramps up, there would be larger profits leading to better return.
Chart 2: Operating Profit and Margins (Author)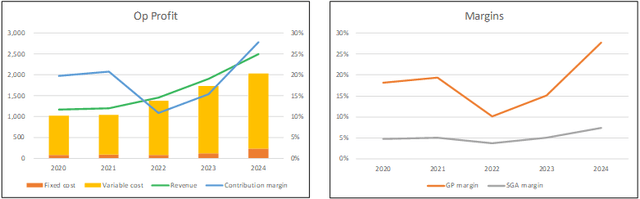
Note to Op Profit Profile. I broke down the operating profits into fixed costs and variable costs.
- Fixed cost = SGA, Depreciation & Amortization and Others.
- Variable cost = Cost of Sales – Depreciation & Amortization.
- Contribution = Revenue – Variable Cost.
- Contribution margin = Contribution/Revenue
The volatile PAT resulted in volatile returns as illustrated by the ROIC, ROE, and CFROIC in the left part of Chart 3. The returns have been extraordinary post-IPO. From 2023 to 2024, ROIC averaged 24% while ROE averaged 38%.
The challenge is whether these high returns are sustainable. In this context, I have some concerns as there were no improving capital efficiency trends. Referring to the right part of Chart 3,
- Gross profitability (gross profits/total assets) and capital turnover (revenue/total capital employed) in 2023 were lower than those in 2020.
- The cash conversion cycle in 2024 was about 2.5 times that in 2020.
Chart 3: Returns and Capital Efficiencies (Author)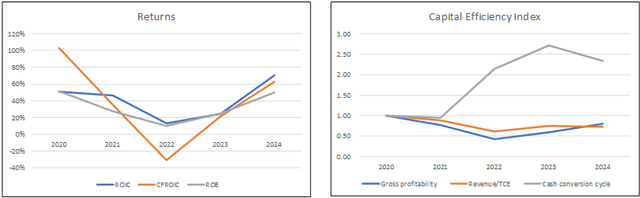
Peer comparison
In its 2024 Form 10k, Nextracker listed several competitors. I compared Nextracker’s performance with those peers with publicly available data.
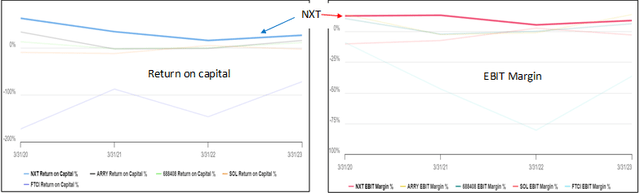
You can see that Nextracker is the biggest one in the peer group in terms of revenue and revenue growth. Refer to Table 1. When it came to return on capital and EBIT margin, Nextracker’s performance was the best. Refer to Chart 4.
Table 1: Peer Revenue (Author) Chart 4: Peer comparison (Author from Tikr.com)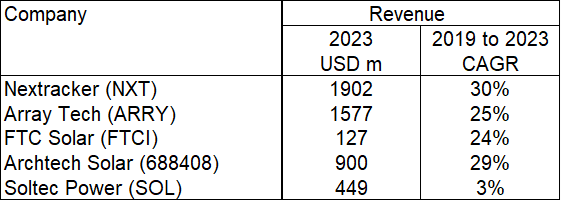
Financial position
I would rate Nextracker’s as financially sound based on the following:
- It had USD 472 million in cash and short-term investments as of the end of Jun 2024. This was about 18% of its total assets.
- As of Jun 2024, it had a debt-capital ratio of 11%. This has come down from its 2023 high of 24%.
- Including the acquisitions, it had an average Reinvestment rate of 32% over the past 5 years. This meant that a big part of NOPAT could be channeled to shareholders or to reduce debt.
- It had a good capital allocation plan as shown in Table 2. The cash flow from operations was enough to fund its CAPEX with excess returned as dividends.
Table 2: Sources and Uses of Funds 2020 to 2024. (Author)
Its main negative points were that from 2020 to 2024:
- It delivered positive cash flow from operations in 4 out of the 5 years.
- During this period, it generated USD 725 million cash flow from operations compared to its USD 911 million net income. This is not a good cash conversion ratio.
But I think the positive points more than outweigh the negative ones.
Valuation
My fundamental analysis shows that there is a double-digit revenue growth runway for the company. With a market-leading position, Nextracker ought to be able to benefit from this. The only negative point is that there does not seem to be an improving trend in capital efficiency.
Given the above, I considered 2 Scenarios in my valuation based on different growth paths.
Scenario 1. This is a pessimistic one assuming that the company would not be able to tap into the double-digit growth runway. Rather I assumed that it had reached maturity with revenue growing at 4% CAGR. I also assumed that revenue, contribution margin, and capital efficiency (as represented by revenue/total capital employed) would be the 2023/24 averages.
Scenario 2. This is a realistic one where revenue growth would decline from 21% to 4% terminal growth over the next 6 years. The starting values for the key parameters would be the 2023/24 averages. I also assumed that the capital efficiency would decline by 10% in the 6th year.
With a market price of USD 42 per share (26 Aug 2024), there was no margin of safety under Scenario 1 given the intrinsic value of USD 41 per share.
But there is a 69% margin of safety under Scenario 2 given the intrinsic value of USD 71 per share.
I would like to think that Scenario 1 is very unlikely. I would even consider Scenario 2 as conservative. With more than 30% margin of safety under Scenario 2, Nextracker is an investment opportunity.
Valuation model – Scenario 1
I used a single-stage Free Cash Flow to the Firm (FCFF) model where the EBIT was determined based on the following:
FCFF = EBIT(1 – t) X (1 – Reinvestment rate) X (1 + g) / (WACC – g).
EBIT = Revenue X Contribution margin – Fixed cost. This was based on the operating model as shown in the left part of Chart 2.
The reinvestment rate was derived from the fundamental growth equation of g = Return X Reinvestment rate.
Fixed cost = SGA + R&D expenses.
Value of equity = Value of firm + Cash + Other investments – Debt – Minority interests + excess Total capital employed.
There are 4 key variables in the valuation model:
- Revenue.
- Contribution margin representing operating efficiency. Note that this excluded the IRA credits.
- Capital turnover representing capital efficiency.
- Growth rate
For the first 3 variables, I assumed the respective average 2023/24 values. For the growth rate, I assumed the long-term GDP growth rate of 4%.
Table 3 illustrates the calculation for Scenario 1.
Table 3: Estimating the intrinsic value – Scenario 1 (Author)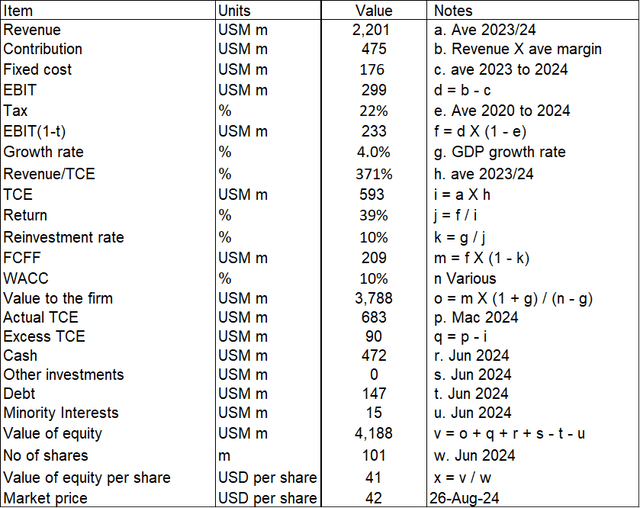
The WACC was determined from the first page results of a Google search for “Nextracker WACC” as illustrated in Table 4.
Table 4: Estimating the WACC (Various)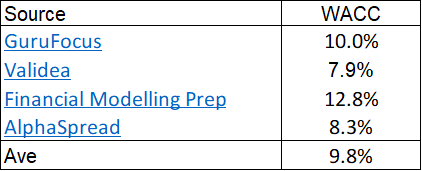
Valuation model – Scenario 2.
This was based on a multi-stage growth model as shown in Table 5. The key feature of this model is that apart from enabling the growth rates to vary, the capital efficiency could be varied.
The key assumptions used are stated in the accompanying notes.
Table 5. Estimating the intrinsic value – Scenario 2. (Author)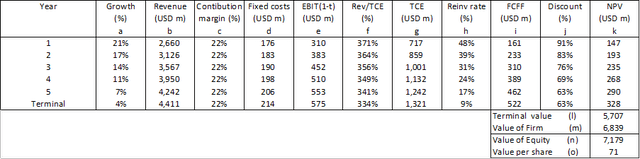
Notes to Table 5:
a) Straight line reduction.
b) Starting revenue based on 2023/24 average. Pegged to growth rate.
c) Assumed average 2023/24 rate and there is no improvement.
d) Starting based on 2023/24 average cost. Assumed growth at terminal rate.
e) Revenue X Margin and after accounting for Fixed costs.
f) Starting based on average 2023/24 and declining to be 10% lower in the terminal year.
g) Revenue X (Revenue/TCE) ratio. TCE = total capital employed.
h) Based on growth equation.
i) FCFF for each year = e X (1-h).
j) Assumed constant D/E ratio. Refer to WACC table.
k) NPV for each year = (i X j).
l) Terminal for the year discounted at 4% growth rate.
m) 5 years NPV + terminal value.
n) Inclusive of any excess TCE. Non-operating assets, MI, and Debt based on Jun 2024.
o) Based on Jun 2024 number of shares
Risks and limitations
There are 2 key risks/limitations in my valuation.
- Duration of growth runway.
- 2 years of post-IPO data.
In Scenario 2, I assumed that the high-growth runway would last for 5 years. Looking at the market reports, you will agree that this is a conservative picture. The solar power generation sector has more than 5 years to go before reaching maturity. It is obvious that if the double-digit growth was to be for a longer period, the estimated intrinsic value would be higher.
The other limitation is that there are only 2 years of post-IPO data to derive the contribution margin and capital efficiency. You can see from Charts 2 and 3 that these metrics are quite volatile.
If I had used the 2020 to 2024 averages for these 2 metrics, the intrinsic values would be:
- USD 34 per share under Scenario 1.
- USD 60 per share under Scenario 2.
The positive point is that there is still more than 30% margin of safety under Scenario 2.
Conclusion
Nextracker is a market leader in providing solar tracking solutions to the growing solar power generation sector. Over the past 5 years, the company has achieved double-digit revenue growth and there is a good chance that it will continue to do so for some time.
The company delivered double-digit returns since its 2023 IPO. Its cost structure meant that as revenue ramps up, there will be bigger profits leading to better returns.
The company is financially sound and seems to be among the better performers among its peers.
On top of these, there is more than a 30% margin of safety based on a multi-stage growth model. You can see why I consider Nextracker an investment opportunity.
Read the full article here

")


")
