


Newsflash: It’s not 1995
Some have often compared this period to 1995 or called it a 1995 moment. This is not 1995, and there are vast differences today between the profile of the S&P 500 (SP500) and from a Fed rate cycle.
The idea of a Fed rate-cutting cycle helping equities seems pretty far-fetched, especially given the size of the run-up in equity valuations over the past year. Additionally, based on earnings estimates, current growth rates for the next twelve months in the S&P 500 are rolling over. Historically, growth rates have significantly impacted the S&P 500 and the market’s P/E multiple.
Valuations were much lower in 1994 and 1995, while the Fed rate cuts were minor compared to what was expected in 2025.
Rate Cuts Won’t Help
The expansion of the P/E ratio has driven the majority of the rally over the past 12 months. Since August 2023, the S&P 500’s P/E ratio has risen by 13.9% to 21.2 times its next twelve-month earnings estimates. Meanwhile, earnings are expected to grow by 11.3% over the next twelve months to $263.28 per share.
Bloomberg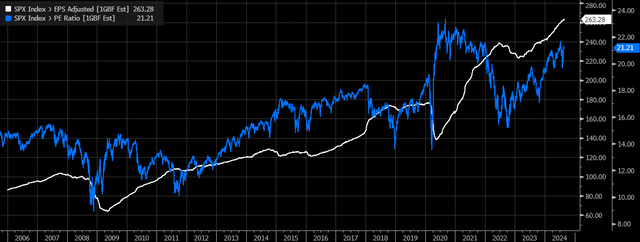
The current P/E ratio of the S&P 500 is the third highest since 1990, while the expected earnings growth rate for this cycle is likely to be among the lowest. The only cycle that saw lower earnings growth came in 2014 when it peaked at around 8.3% and had a P/E ratio of around 15.6. This would suggest that investors are paying a lot to own stocks that are just not delivering the growth rates one would expect to receive in the past.
SPX 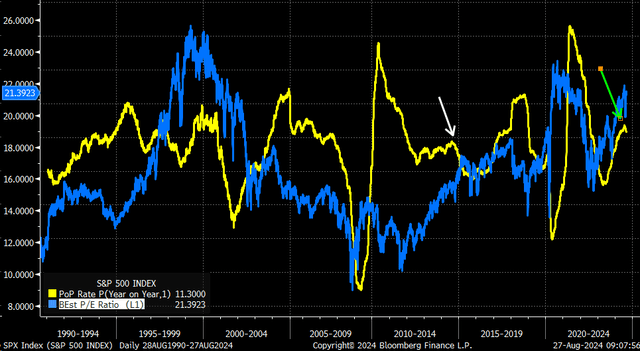
Additionally, in the past, when the Fed cut rates, at least going back to 1990, P/E multiples contracted at first. We saw this in 1990, 2000, 2008, and briefly in the summer of 2019. Generally, when the Fed cuts rates, it is accompanied by a recession, which causes economic and earnings growth to slow, leading to a lower P/E ratio.
Bloomberg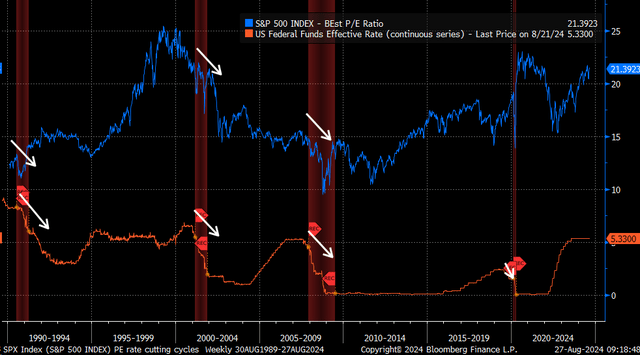
It’s Not 1995
Some will point to the rate hike cycle of 1994 and try to compare that cycle with the current one, but this cycle appears different regarding several items. First, the Fed only cut rates 75 bps in 1995 and 1996. The market is pricing in 9 rate cuts between now and December 2025, bringing the effective funds rate down to 3.05%.
Bloomberg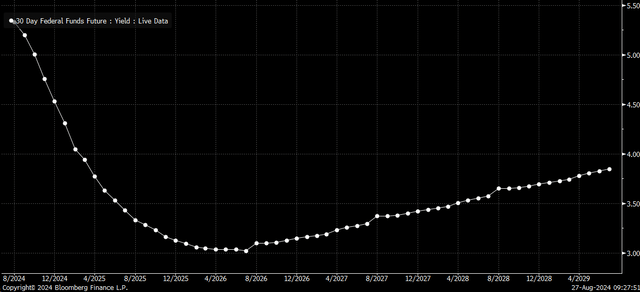
Additionally, the yield curve never inverted from 1993 through 1996. In fact, during that time, the yield curve was positive, and positive by quite a bit, staying pretty firmly above +40 bps throughout the process. It is an entirely unique message than what the bond market is portraying now, after one of the most extensive inversions ever.
Bloomberg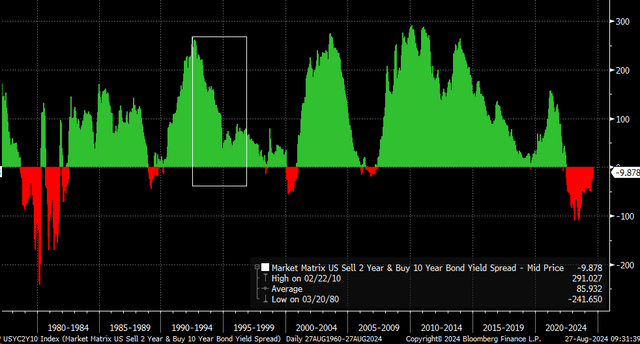
Further, at the end of 1994, heading into 1995, the S&P 500 P/E ratio was only 13.1, versus its 21.4 today. That is a big difference in terms of market valuations. The former is on the lower side of the historical range, while the latter is on the upper. Meanwhile, earnings growth was higher in 1995 and accelerated, not rolling over.
Bloomberg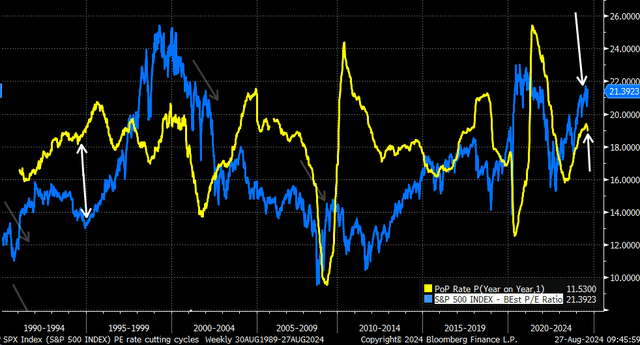
Furthermore, expected market returns, calculated by adding the S&P 500 earnings yield over the trailing twelve months with the 10-year rate, are among the lowest historically going back to the 1960s, at just 7.9%. The only time that was meaningful lower came in that 2020 to early 2022 time frame, and the market saw a big drawdown through 2022 and the first quarter of 2023.
Bloomberg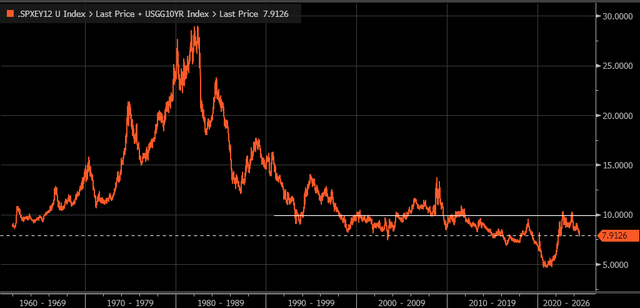
The multiple expansions in the S&P 500 over the past year can be attributed to higher growth rates and expectations that the Fed would start cutting interest. Well, now, the time has come for the Fed to cut rates, and it seems to be coming at a time when earnings growth is slowing. This means that further expansion of the P/E is unlikely, and it is more likely that a period of contraction follows.
Neither will be good for stocks, reminding us that this time is very different from 1995.
Read the full article here


