By Matt Wagner, CFA | Hyun Kang.
Different selection processes among benchmarks can lead to vastly different portfolio holdings, as evidenced by the wide dispersion in returns this year across indexes with the same goals of tracking growth or value factors.
Cumulative Year-to-Date Return Difference: S&P vs. Russell
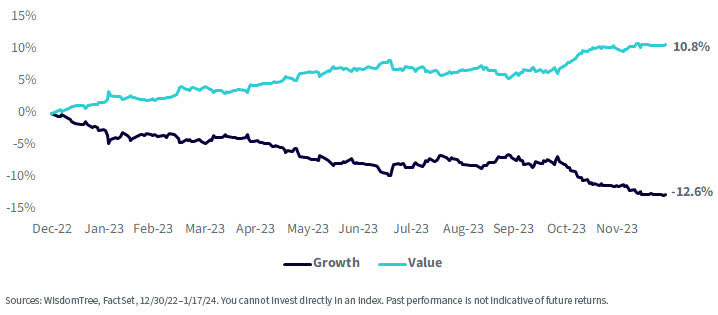
The performance impact of these deviations, even for broad-based benchmarks, is especially magnified in the often more volatile and less efficient mid- and small-cap universes.
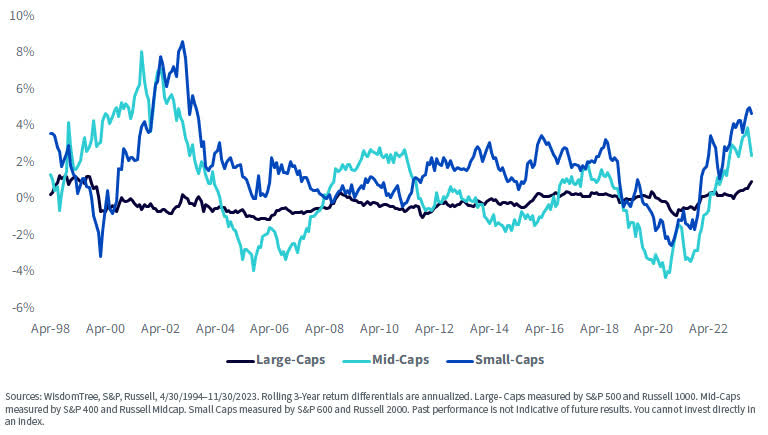
The dark blue line of the large-cap indexes in the below chart hovers closest to a 0% return difference. A market cap-weighted index of the 500 stocks from S&P or of the 1,000 largest stocks from Russell largely mirror each other.
However, moving beyond the largest stocks, the differentials magnify in the mid- and small-cap indexes, showing return differences of over 8% in certain rolling three-year periods.
Return Differentials
Rolling 3-Year Return Difference: S&P vs. Russell Benchmarks
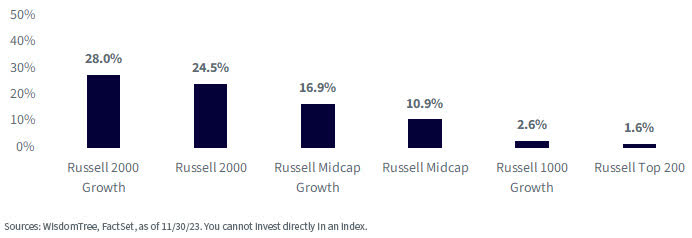
A major driver in relative performance among the small-cap benchmarks is the weight that unprofitable companies—which are generally excluded from initial inclusion into S&P indexes—account for in each universe.
In mid- and small-cap indexes, particularly small-cap growth indexes, unprofitable companies can make up over one-fourth of the weight of the index, and over 40% of the company count.
Unprofitability across Indexes
Count of Unprofitable Companies

Weight of Unprofitable Companies
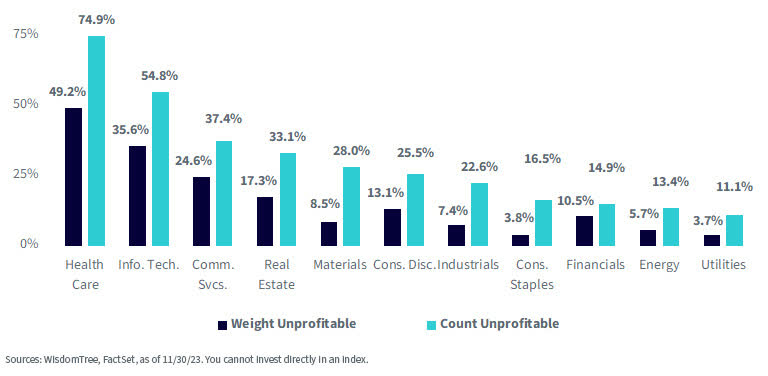
In general, these unprofitable companies are found in the Health Care and Information Technology sectors; almost 75% of mid- and small-cap Health Care and 55% of Information Technology companies are unprofitable.
Screening for quality (profitability) in a growth universe, by design, results in under-weights to these unprofitable companies.
Unprofitability across Sectors
Why Quality for Mid-Caps and Small Caps
Investors are familiar with the standard value, blend and growth styles.
Why quality?
Many investors often think large cap when they think of quality.
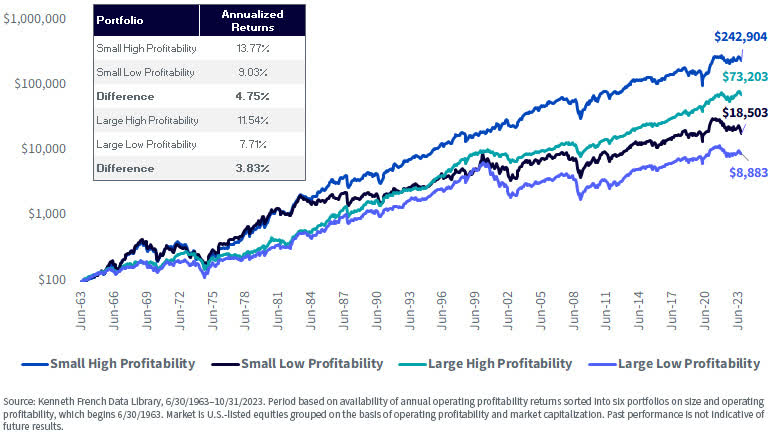
High-profitability small caps have outperformed high-profitability large caps over the long run.
The performance spread between high-profitability and low-profitability companies is even greater within small caps than large caps.
Cumulative Growth of $100
WisdomTree U.S. MidCap and SmallCap Quality Growth Indexes
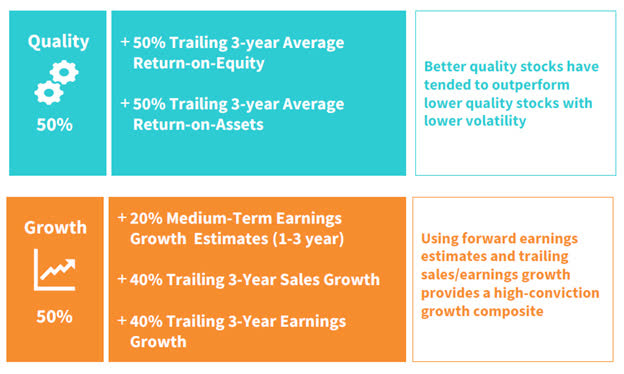
The WisdomTree U.S. MidCap and SmallCap Quality Growth Indexes are market cap-weighted Indexes that consist of companies with quality and growth characteristics.
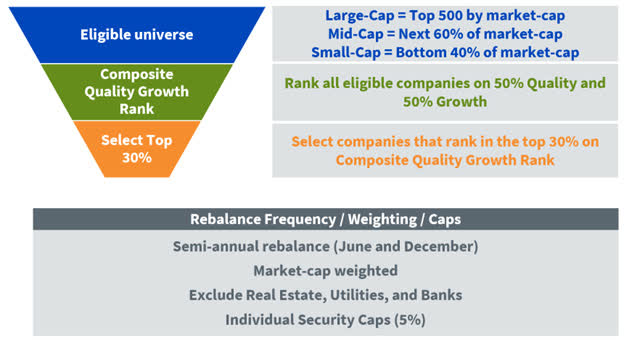
The Indexes are comprised of the top 30% of companies with the highest composite scores. Real Estate, Utilities and Banks are excluded from the Indexes because companies from these sectors tend to have lower earnings growth and/or high earnings volatility (lowering earnings quality).
Investment Process
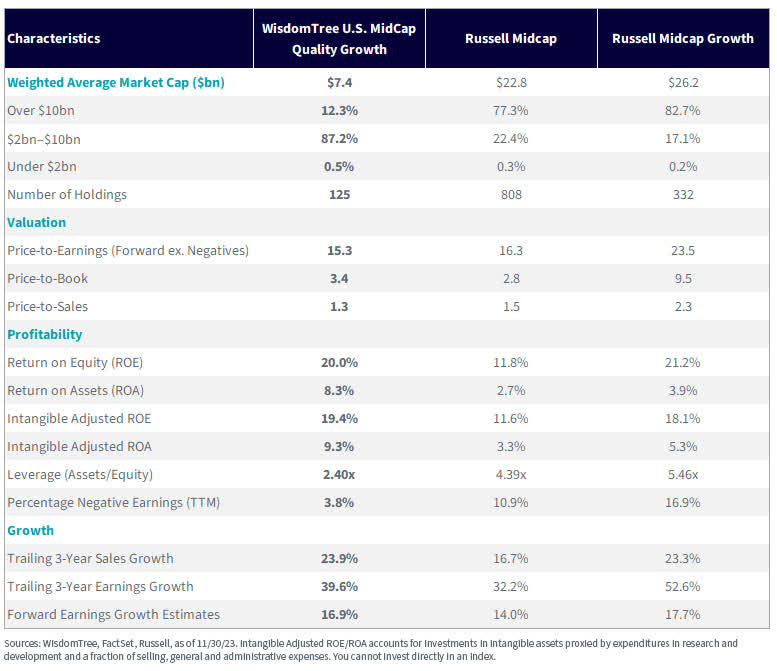
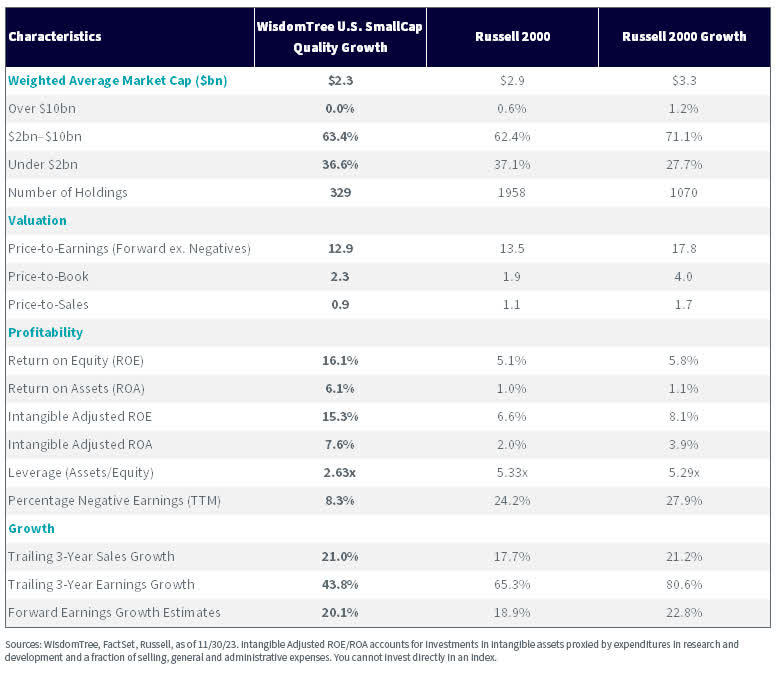
These Indexes are each narrower in terms of number of holdings than the corresponding Russell indexes, representing a higher conviction quality growth basket that more selectively weeds out “junkier” companies.
Each Index skews toward a smaller weighted average market cap than the Russell indexes, with the difference more pronounced in the mid-cap version, where the Russell indexes have more than one-quarter of their weight in companies with over $10 billion in market cap.
As each Index selects companies that are both profitable and have higher growth, we see consistently higher profitability metrics and generally higher growth metrics.
Index Characteristics
Introducing the WisdomTree U.S. MidCap Quality Growth Fund (QMID) and the WisdomTree U.S. SmallCap Quality Growth Fund (QSML)
The WisdomTree U.S. MidCap Quality Growth Fund (QMID) seeks to track the price and yield performance, before fees and expenses, of the WisdomTree U.S. MidCap Quality Growth Index.
The WisdomTree U.S. SmallCap Quality Growth Fund (QSML) seeks to track the price and yield performance, before fees and expenses, of the WisdomTree U.S. SmallCap Quality Growth Index.
Why QMID/QSML?
- Gain core exposure to U.S. mid- and small-market capitalization companies that display strong quality and growth characteristics
- Avoid the mid- and small-cap “story stocks” with low, or negative, profitability

Important Risks Related to this Article
QMID: There are risks associated with investing, including the possible loss of principal. Growth stocks, as a group, may be out of favor with the market and underperform value stocks or the overall equity market. Growth stocks are generally more sensitive to market movements than other types of stocks. The Fund is non-diversified and, as a result, changes in the market value of a single security could cause greater fluctuations in the value of Fund shares than would occur in a diversified fund. The Fund invests in the securities included in, or representative of, its Index regardless of their investment merit. The Fund does not attempt to outperform its Index or take defensive positions in declining markets and the Index may not perform as intended. Please read the Fund’s prospectus for specific details regarding the Fund’s risk profile.
QSML: There are risks associated with investing, including the possible loss of principal. Growth stocks, as a group, may be out of favor with the market and underperform value stocks or the overall equity market. Growth stocks are generally more sensitive to market movements than other types of stocks. Funds focusing their investments on certain sectors and/or smaller companies increase their vulnerability to any single economic or regulatory development. This may result in greater share price volatility. The Fund is non-diversified and, as a result, changes in the market value of a single security could cause greater fluctuations in the value of Fund shares than would occur in a diversified fund. The Fund invests in the securities included in, or representative of, its Index regardless of their investment merit. The Fund does not attempt to outperform its Index or take defensive positions in declining markets and the Index may not perform as intended. Please read the Fund’s prospectus for specific details regarding the Fund’s risk profile.

Associate Director, Research
Matt Wagner joined WisdomTree in May 2017 as an Analyst on the Research team. In his current role as an Associate Director, he supports the creation, maintenance, and reconstitution of our indexes and actively managed ETFs. Matt started his career at Morgan Stanley, working as an analyst in Treasury Capital Markets from 2015 to 2017 where he focused on unsecured funding planning, execution and risk management. Matt graduated from Boston College in 2015 with a B.A. in International Studies with a concentration in Economics. In 2020, he earned a Certificate in Advanced Valuation from NYU Stern. Matt is a holder of the Chartered Financial Analyst designation.

Hyun Kang joined WisdomTree in July 2022 as a Research Analyst. As a part of the Index team, he assists with the creation and maintenance of the firm’s indexes and supports the group’s research initiatives across various strategies. Hyun graduated from Carnegie Mellon University, with a B.S. in Business Administration and an additional major in Statistics and Machine Learning.
Original Post
Editor’s Note: The summary bullets for this article were chosen by Seeking Alpha editors.
Read the full article here


