")


|
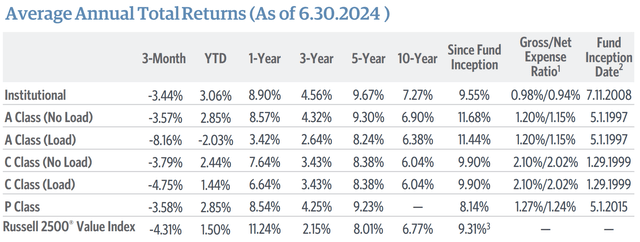
Performance displayed represents past performance, which is no guarantee of future results. Investment return and principal value will fluctuate so that when shares are redeemed, they may be worth more or less than original cost. Current performance may be lower or higher than the performance data quoted. For up-to-date fund performance, including performance current to the most recent month end, please visit our website at GuggenheimInvestments.com. Load performance reflects maximum sales charges or contingent deferred sales charges (CDSC) as applicable. A Class shares have a maximum sales charge of 4.75%. Effective 2.22.2011, the A Class maximum front-end sales charge was changed from 5.75% to 4.75%. For performance periods that begin prior to 2.22.2011, a 5.75% load was used and for performance periods that begin after 2.22.2011, a 4.75% load was used. C Class shares have a maximum CDSC of 1% for shares redeemed within 12 months of purchase. Unless otherwise noted, data is as of 6.30.2024. Data is subject to change on a daily basis. Partial year returns are cumulative, not annualized. Returns reflect the reinvestment of dividends. The referenced index is unmanaged and not available for direct investment. Index performance does not reflect transaction costs. Source: FundStation. [1] The advisor has contractually agreed to waive fees and expenses through 2.1.2025 to limit the ordinary operating expenses of the fund. See the prospectus for more information about fees and expenses. |
The Board has approved the reorganization of this fund into the New Age Alpha SMid Cap Value Fund, on or about October 25, 2024, subject to shareholder approval. Please read the prospectus for further information.
Strategy and Market Overview
Our investment approach focuses on understanding how companies make money and how easily they can either improve returns, maintain existing high levels of profitability or benefit from change that occurs within the industries in which they operate. In today’s rapid-fire environment marked by very sharp and quick, but constrained volatility, we believe our long-term orientation and discipline is a competitive advantage. This should become especially critical when the environment of indiscriminant valuation expansion subsides, and fundamentals once again become a more dominant factor in the market.
Performance Overview
For the quarter, the SMid Cap Value Fund outperformed the benchmark by declining 3.57 percent versus a -4.31 percent loss for the Russell 2500 Value Index. While stock selection and industry weightings helped the fund’s performance versus the benchmark, the overall market continued to greatly favor large cap, growth-oriented technology companies as the AI theme garnered increasing attention. On the positive side for the SMid Cap Value Fund, stock selection was robust in the technology, financials, and industrial sectors. Technology holdings in the strategy gained 8.8 percent versus a decline of -0.4 percent for similar companies in the benchmark. Teradyne (TER) (+31.5 percent) and Amkor Technology (AMKR) (+29.5 percent) posted gains as increasing chip technology is boosting demand for sophisticated chip testing products. Coherent Corp (COHR) (+19.5 percent) gained as the market responded enthusiastically to the appointment of new CEO Jim Anderson, who was previously the CEO of Lattice Semiconductors. Technology selection added about 116 bps to overall performance.
In the financials sector, the M&A environment picked up which provided earnings support and enthusiasm for the fund’s holdings in the brokerage space with gains by Stifel Financial (SF) (+13.5 percent) and Jefferies (JEF) (+8.2 percent). Overall, the fund’s financials holdings gained 1.0 percent versus a -2.6 percent decline for the benchmark’s holdings in the sector. This success aided overall performance by 58 basis points. Lastly, selection in the industrials sector was favorable with this sector outperformed by declining -4.5 percent versus a -6.6 percent decline in the benchmark. The most notable successes were Kirby (KEX) (+25.6 percent) as inland barge transportation rates have been very strong. Leidos (LDOS) performed well (+11.5 percent) on the heels of a solid quarter. Industrials selection aided overall portfolio performance by 45 basis points.
Negative contributors to relative performance in Q2 were primarily related to stock selection in the materials, consumer staples, and health care industries. Holdings in the materials sector declined -12.0 percent in value while the benchmark’s holdings fell -6.5 percent. A small position in Ginkgo Bioworks (DNA) (-72 percent) hurt overall results by 18 basis points. The company continues to tinker with its business model in order to attract more large pharmaceuticals companies to use its cell engineering automation technology to aid in drug discovery. A larger position, Sonoco Products (SON) (-11.5 percent) also hurt overall portfolio performance by 18 basis points as the market reacted unenthusiastically to the announced acquisition of Eviosys from private equity which expands the company’s presence in metal can packaging. Overall, selection in the materials sector penalized the fund’s overall performance by 84 basis points. Stock selection in the consumer staples sector was unfavorable as holdings in this sector declined -8.6 percent versus a -2.4% decline in the benchmark sector holdings. The performance largely centered around a decline in MGP Ingredients (MGPI) (-13.4 percent). While the company continues to meet expectations, the sentiment about the company’s prospects is being dampened by the continued underperformance of the spirits alcoholic beverage category. Selection in the staples sector hurt overall performance by 34 basis points. Lastly, health care selection was unfavorable as holdings fell – 10.5 percent versus a -7.7 percent decline in the benchmark. This hurt overall performance by 25 basis points. Enovis (ENOV) (-27.6 percent) declined as weaker than expected earnings caused the market to question the benefits of recent acquisitions. Evolent Health (EVH) (-41.7 percent) suffered as higher than anticipated utilization at large HMO clients caused the market to be concerned as to whether the firm’s capitated fee structure would be able to offset the higher levels of expenses.
Portfolio and Market Outlook
Portfolio turnover in the quarter ran below the normal 40% – 80% typical range. Cash during the quarter increased by 1.4 percent to end the quarter at 2.1 percent. The active weight in the technology sector increased by 1.5 percent primarily reflecting the initiation of Amkor Technology. No other sector weightings increased by more than one percent. The largest active weighting decreases occurred in health care (- 1.2 percent) and financials (- 1.15 percent) as the position in Evolent Health was trimmed and several of the bank positions were trimmed.
The market outlook continues to be murky. Of late, the inflation data continues to make progress and appears to be headed lower while the economy continues to perform as well or better than expected. The enthusiasm for potential rate cuts continues to support an upward bias to the market. However, the stronger the market becomes, the less inclined the Fed will likely be to pursue interest rate reductions aggressively. We still prefer our bias to quality names and our overall positioning.
Top 10 Holdings
|
Unum Group (UNM) |
2.89% |
|
Jefferies Financial Group |
2.54% |
|
Teradyne Inc |
2.44% |
|
Stifel Financial Corp. |
2.42% |
|
Pinnacle West Cap Corp (PNW) |
2.38% |
|
Oge Energy Corp (OGE) |
2.30% |
|
Old Republic Intl Corp (ORI) |
2.27% |
|
Encompass Health Corp. (EHC) |
2.27% |
|
Evergy Inc (EVRG) |
2.25% |
|
Diamondback Energy (FANG) |
2.23% |
|
Total |
23.98% |
|
[2] Institutional Class shares of the Guggenheim SMid Cap Value Fund (the “fund”) are newly organized. The Guggenheim SMid Cap Value Institutional Fund (the “Predecessor Fund”), which pursued the same investment objective and was managed in the same manner as the fund, reorganized with and into Institutional Class shares of the fund effective 1.3.2020. The fund has adopted the Predecessor Fund’s performance history with respect to its Institutional Class shares. Accordingly, the performance of the Institutional Class shares of the fund shown is the performance of the Predecessor Fund. The returns have not been restated to reflect the fees and expenses applicable to the Institutional Class shares of the fund and could have been lower had such an adjustment been made. [3] Returns are for the period 5.01.1997-6.302024 (since inception of SMid Cap Value Fund A Class). |
|
Bps-basis points. One basis point is equal to 0.01%. Risk Considerations: This fund may not be suitable for all investors. Investing in mutual funds involves risk and does not assure a profit. • An investment in the fund will fluctuate and is subject to investment risks, which means investors could lose money. • The intrinsic value of the underlying stocks may never be realized or the stocks may decline in value. • Investments in small- and/or mid-sized company securities may present additional risks such as less predictable earnings, higher volatility, and less liquidity than larger, more established companies. • Shares of mutual funds are not deposits of, or guaranteed or endorsed by, any financial institution; are not insured by the Federal Deposit Insurance Corporation (FDIC), the Federal Reserve Board, or any other agency; and involve risk, including the possible loss of the principal amount invested. • Please read the prospectus for more detailed information regarding these and other risks. Russell 2500® Value Index measures the performance of small- to mid-cap value segment of the U.S. equity universe. It includes those Russell 2500® Index companies with lower price- to-book ratios and lower forecasted growth values. Read the fund’s prospectus and summary prospectus (if available) carefully before investing. It contains the fund’s investment objectives, risks, charges, expenses, and other information, which should be considered carefully before investing. Obtain a prospectus and summary prospectus (if available) at GuggenheimInvestments.com. This material is not intended as a recommendation or as investment advice of any kind, including in connection with rollovers, transfers, and distributions. Such material is not provided in a fiduciary capacity, may not be relied upon for or in connection with the making of investment decisions, and does not constitute a solicitation of an offer to buy or sell securities. All content has been provided for informational or educational purposes only and is not intended to be and should not be construed as legal or tax advice and/or a legal opinion. Always consult a financial, tax and/or legal professional regarding your specific situation. The referenced fund is distributed by Guggenheim Funds Distributors, LLC. Guggenheim Investments represents the investment management businesses of Guggenheim Partners, LLC (“Guggenheim”), which includes Security Investors, LLC (“SI”), the investment advisor to the referenced fund. Guggenheim Funds Distributors, LLC is affiliated with Guggenheim and SI. |
Original Post
Editor’s Note: The summary bullets for this article were chosen by Seeking Alpha editors.
Read the full article here
")

")

")
")