


")
It is often hard to balance stock momentum with fundamentals. When they are aligned, you generally don’t have a problem. But when they send you contradictory messages, you have to take advantage of the discrepancy. That is easier said than done. Let’s look at our protagonist for today, Global Net Lease, Inc. (NYSE:GNL) and tell you how we see the divergences evolving.
The last 6 months have been kind to GNL. At least on a price action basis. The REIT has actually kept up with the Vanguard Real Estate ETF (VNQ).
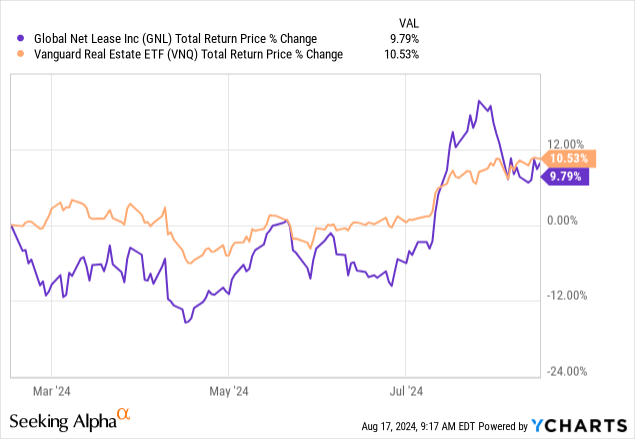
That might sound too pessimistic. How can we give a REIT credit just for keeping up with an index? Well, the longer-term chart should help you figure that out.
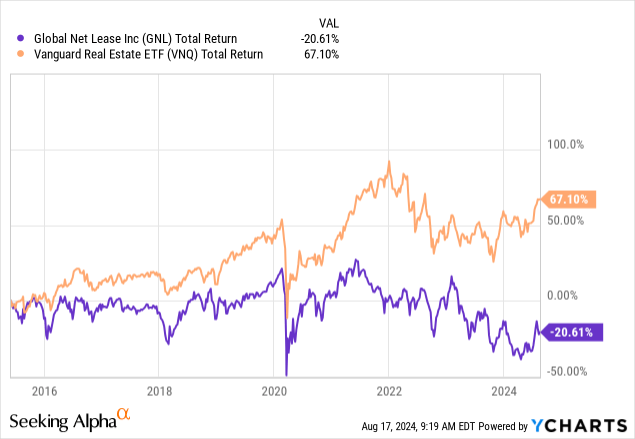
GNL has produced negative total returns (that includes those massive dividends) since inception. So the last 6 months have been an outlier, and we are going to tell you why the longer-term trend likely reasserts.
Q2-2024
The Q2-2024 announcement was met with cheer as GNL apparently hit all the right notes. Great renewals and a leverage reduction were the key talking points. They also added that their synergy realization was ahead of schedule.
GNL Q2-2024 Presentation 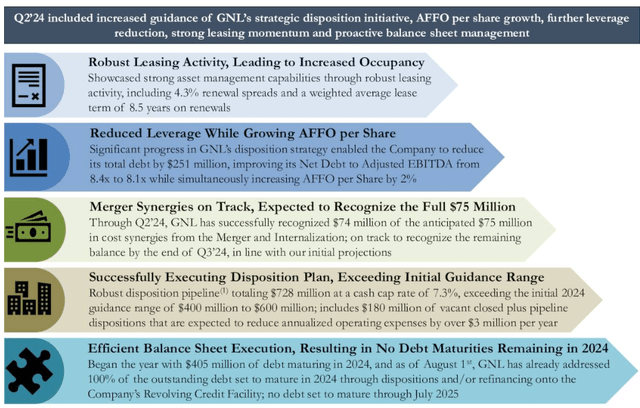
GNL raised the ante for the bears by saying that they were going to sell even more properties. The company that could not stop buying regardless of cap rates and where their own stock was trading, has now reversed course and that is apparently a good thing.
GNL Q2-2024 Presentation 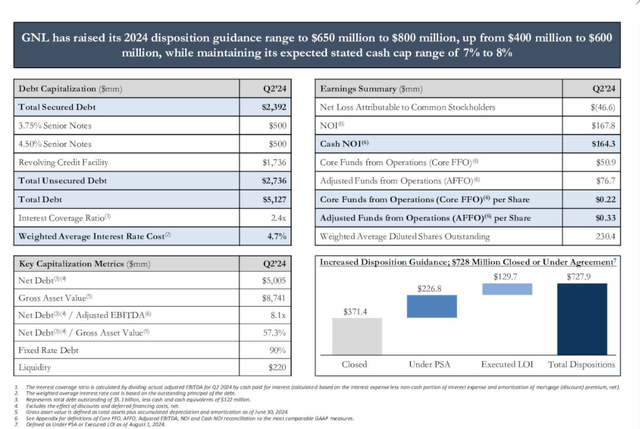
That is about where the average investor focused on yield hit the snooze. But even in the company’s own cheery forecast, there were some glaring red flags. For starters, the new set of asset sales were focused on properties with really long lease terms. This probably is a reflection of how the commercial real estate market is still in full implosion mode regardless of what the S&P 500’s (SPY) levitation tells you.
GNL Q2-2024 Presentation 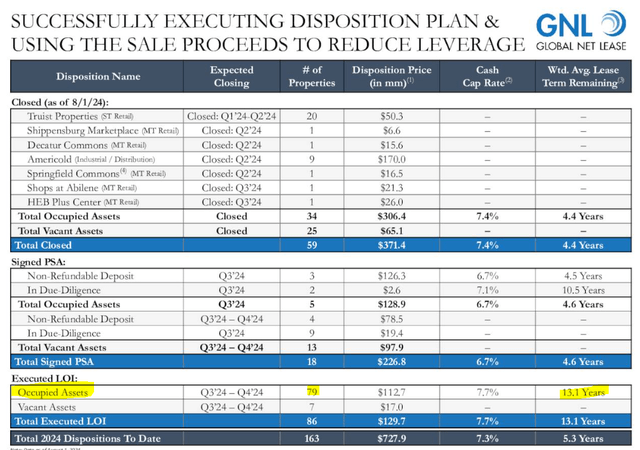
Even before these sales, GNL’s weighted lease term is down to 6.5 years. For those that might know this, this length is really short for a triple net lease REIT. Most REITs we cover average around 10 years.
GNL Q2-2024 Presentation 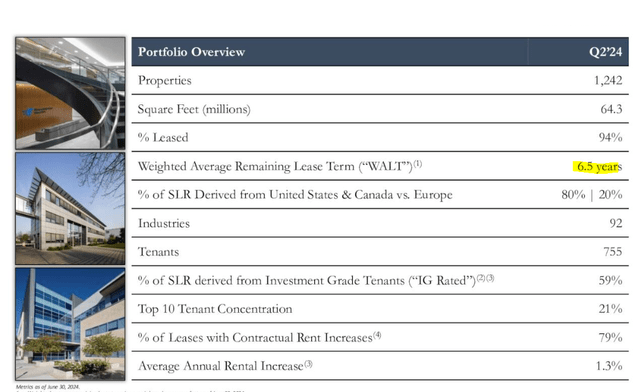
GNL itself started off near 10 years and over time, despite its best efforts (selling vacant properties for peanuts) this has gradually reduced. At the end of 2022 this was at 8.9 years.
GNL Q4-2022 Presentation 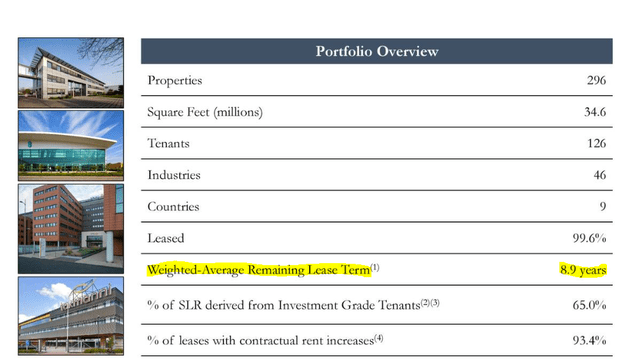
Sure, some can be attributed to that merger. But on the whole these lease terms have been going in one direction only. Where these numbers will be once GNL starts selling assets with 13-year lease terms requires no complex math skills. What is even more troubling here is that the most vulnerable assets in within the GNL portfolio, have the worse lease terms. We are referring to single tenant office and here we are likely to see non-renewals and potentially defaults as well.
GNL Q2-2024 Presentation 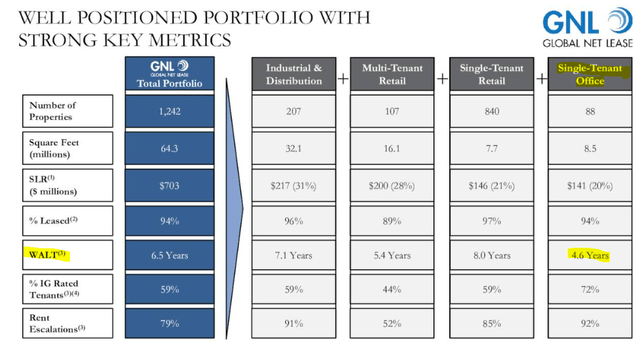
Fundamentally the story is about as broken as it can get. This might sound harsh but keep in mind that we once argued that a covered call strategy on GNL could actually work out. We exited that some time back as no amount of protection was enough for the risks we saw.
Dividend Coverage
The slow-motion train wreck thesis is easy to get behind here but there are other reasons to believe that this might not exactly be going at a snail’s pace. Here we are referring to the dividend coverage and everyone who has followed GNL knows the party line. The dividend is always covered according to GNL and still is regularly reduced.
NASDAQ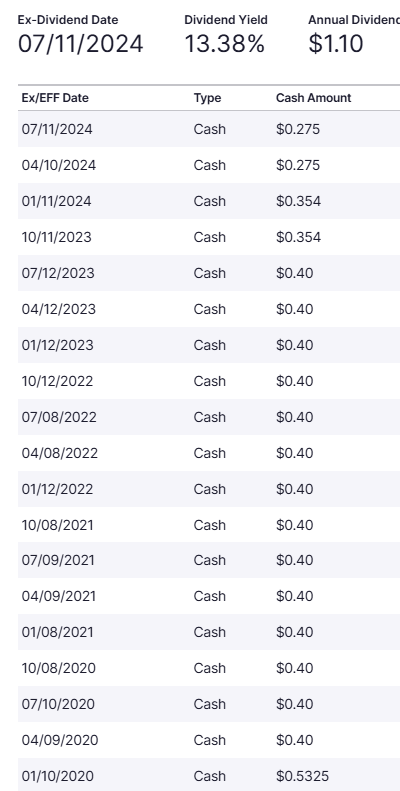
Of course our point here today is that two quarters into this latest dividend cut, the company produced funds from operations (FFO), as defined by NAREIT of 16 cents ($36.19 million).
GNL Q2-2024 Presentation 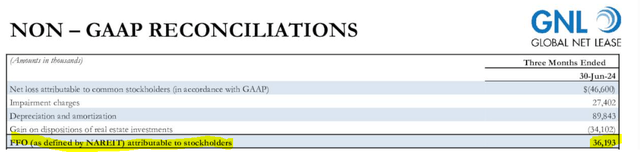
We are not making that up. That comes straight from GNL. 16 cents, last we checked, was definitely not more than the 27.5 cents of dividend. But GNL does reach a whopping 33 cents in this quarter, going through a lot of add backs.
GNL Q2-2024 Presentation 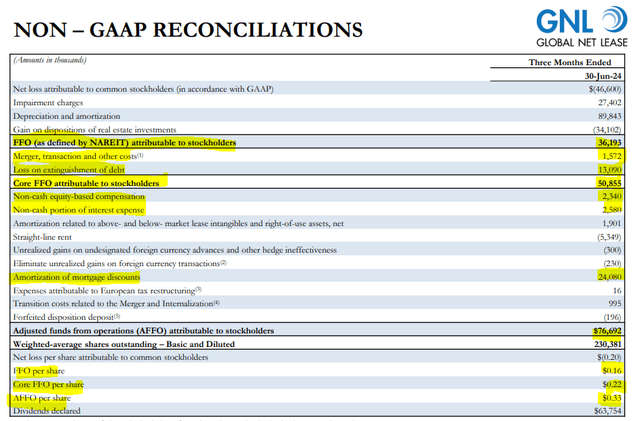
Pretty much everything that is being added back to that NAREIT number is regular, non-recurring cost to the company. So it should not be added back if you are serious of understanding the underlying cash flows. Even more interestingly, there is one big item conspicuously missing, which should be subtracted out. Any guesses?
10-Q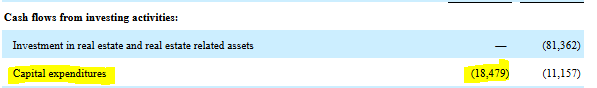
That $18.5 million is a 6-month number so about half of that should be taken out of the NAREIT FFO. Realistically, we would accept NAREIT FFO + equity compensation – capex – straight line rent, as AFFO. So our definition of AFFO would be around $24 million or 10 cents per share.
Verdict
It looks like the worst is over for real estate. The enthusiasm for the Federal Reserve rate cuts have certainly made bear hunting a more fun activity. After years of saying “it is the best time to buy in years”, bulls are actually having a day in the sun. We don’t see it that way, at least for REITs that were doing a poor job to begin with. We are now moving GNL to a Sell and think downside could be material over the long run.
Preferred Shares
Investors have latched on to the 4 below as a way of expressing confidence that management will keep the firm afloat.
- Global Net Lease, 7.25% Series A Cumulative Redeemable Preferred Stock (NYSE:GNL.PR.A)
- Global Net Lease 6.875% Series B Cumulative Redeemable Perp Preferred Stock (NYSE:GNL.PR.B)
- Global Net Lease, Inc. 7.50% Series D Cumulative Red Perp Preferred Stock (NYSE:GNL.PR.D)
- Global Net Lease, Inc. 7.375% Series E Cumulative Preferred Stock (NYSE:GNL.PR.E)
But as our math above shows, there is very little cash flow left after interest expenses, and currently this is way less than the dividends being paid on common shares. True AFFO as per our definition is $100 million a year, and we have $4 billion of debt ahead of the preferred shares. We think those preferred shares, while safer than the equity, have a great chance of going down the tubes. We rate them a Sell as well.
Please note that this is not financial advice. It may seem like it, sound like it, but surprisingly, it is not. Investors are expected to do their own due diligence and consult with a professional who knows their objectives and constraints.
Read the full article here


")
