


Introduction
The Fidelity MSCI Industrials Index ETF (NYSEARCA:FIDU), a $1.23bn sized product that provides low-cost exposure to US industrial stocks across the market-cap spectrum, hasn’t done too badly over the past year. Over the last 12 months, it has generated respectable returns of nearly 20%. However, that hasn’t quite been good enough to topple the broader markets, which have beaten our focus product by 1.23x.
YCharts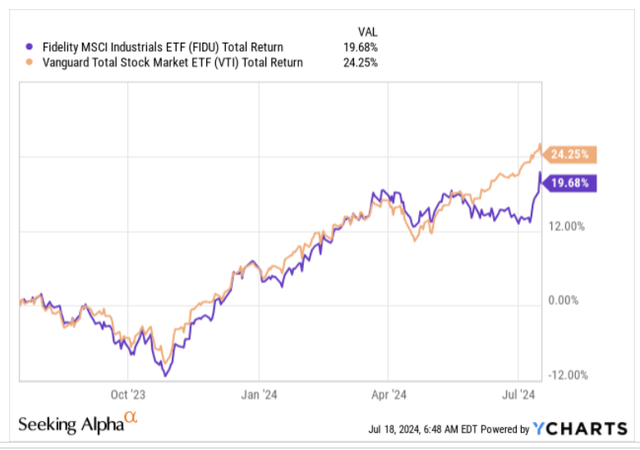
Regardless of its underperformance this year (which is certainly not egregious), there may be a fair few budding investors who are mulling a position in this product. Well, if you’re one of them, here are a few things which may abet your decision.
Is FIDU Better Than Its Largest Peer: XLI?
To ascertain if FIDU is one of the better industrial ETFs around, let’s stack it up against the largest and oldest peer in this space: The Industrial Select Sector SPDR® Fund ETF (XLI). To elaborate further, note that XLI has been around for close to 26 years now, a much longer time span than FIDU, which only made its debut on the bourses in 2013.
XLI’s head start of close to 15 years has played a part in it accumulating far greater assets under management, or AUM, than FIDU, to the tune of over $20bn (essentially 16x the AUM of FIDU).
One of the major differences between XLI and FIDU is that the former is very heavily centered around large-caps alone, which account for 61% of the total portfolio. With FIDU too, large-caps dominate the proceedings (47%), but you also get some useful exposure to small and even micro-cap industrials (aggregating to 26%). On the other hand, the larger ETF doesn’t dabble with micro-caps at all, and only has a minuscule exposure to small-caps. By opening itself up to the riskier terrain of the market, note that FIDU’s volatility profile too is higher than XLI by around 160bps
YCharts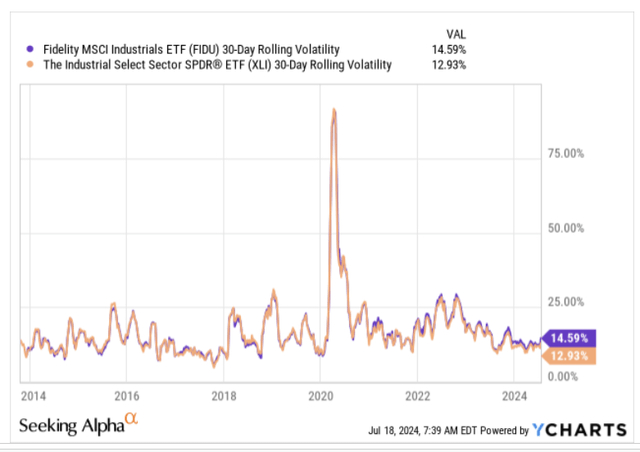
Given that FIDU attempts to dabble with names across the market-cap spectrum, it’s also no surprise to discover that our focus ETF also covers a much wider pool of names (around 370 stocks), whereas XLI is much narrower in focus, touching just 80 industrial stocks. Since FIDU encompasses more stocks, one would’ve thought that it would’ve maintained a lower annual churn rate relative to XLI, but that isn’t quite the case here with a differential of 200bps on the annual turnover ratio front.
From an income angle, note that both products currently lag their respective 4-year averages. However, investors may also want to note that for long periods now, XLI has consistently managed to offer a better yield than FIDU. It is important to note, though, the latter has been doing its best to claw back some territory by growing its dividends at a faster pace over the past 3 years.
YCharts YCharts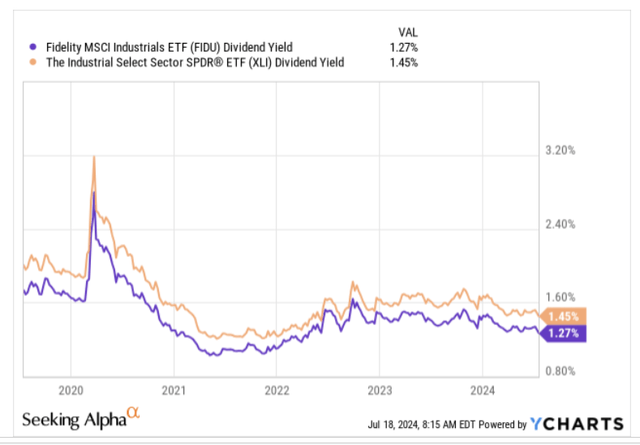
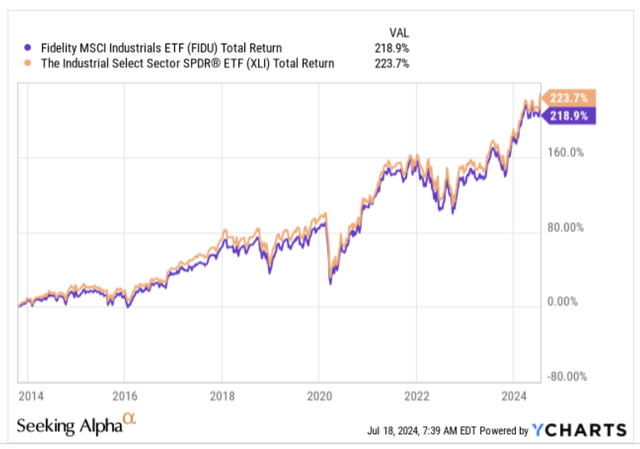
Then, as far as returns go, note that FIDU has mostly underperformed XLI since it made its debut around 10 years back.
Also, if you incorporate the degree of risk taken (measured by the standard deviation) and ascertain the excess return track record of these two products, note that XLI comes out on top with a better Sharpe ratio. Using the same numerator (returns over the risk-free rate), but only looking at downside deviation on the denominator front, and once again, XLI wins the race. So even from a risk-adjusted return angle, FIDU doesn’t feel like a compelling bet against XLI.
Where FIDU offers a slight edge is on the cost front; in fact, not only does it offer a lower expense ratio (0.08%) than XLI alone (0.09%), but also all the other competing industrial ETFs.
All things considered, besides its slightly lower costs, we don’t see why investors should pursue FIDU over XLI. Yes, some investors may point to the additional diversification that you get by garnering exposure to a wider pool of stocks that also encompass a healthy chunk of small and micro-caps. However, as the risk-adjusted return profiles show, you’re only taking on more risk, without quite getting the benefit of better returns.
Seeking Alpha, Morningstar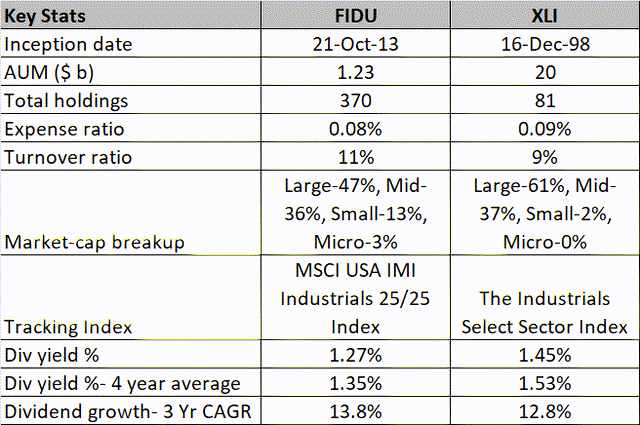
Closing Thoughts: Is FIDU A Good Buy Now?
As noted in the previous section, we are not entirely convinced that FIDU is the best way to gain exposure to industrial stocks in the US.
Trading Economics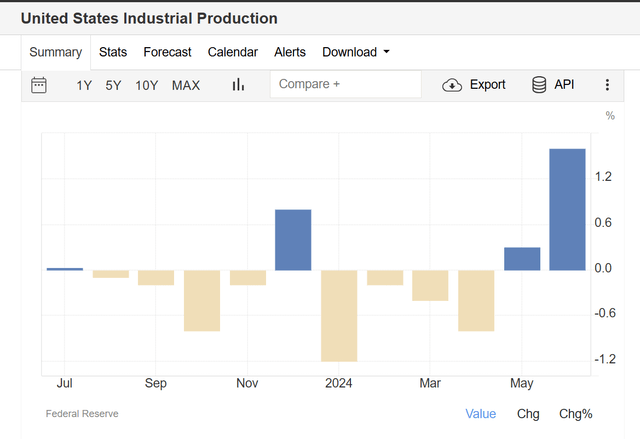
As far as the market data is concerned, it looks like conditions are quite mixed currently. On the positive side, it was encouraging to note that industrial production last month (1.6%) grew at a faster pace than May (0.3%), and also represented the strongest reading in 19 months.
Trading Economics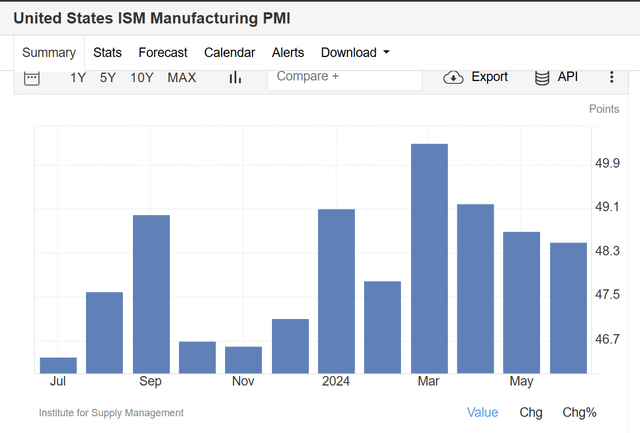
Yet, the ISM Manufacturing PMI index, which is more forward-looking, continues to trend lower for the third straight month. Crucially, the decline in inventories and backlog of orders fell at a more rapid pace. This doesn’t bode well for capacity utilization in the US (77.9% for the manufacturing sector), which is already below its long-term average.
The other important thing to note is that FIDU’s largest sub-sector exposure is towards aerospace and defense companies, but one may question the export prospects of these US firms in light of a Donald Trump re-election as President. Trump has previously shown some aversion towards NATO, and his former National Security Affairs Assistant has suggested that Trump would likely withdraw from NATO if re-elected. If this comes through, American defense exports could take a hit, more so as European governments are also being urged to contract with local defense players.
YCharts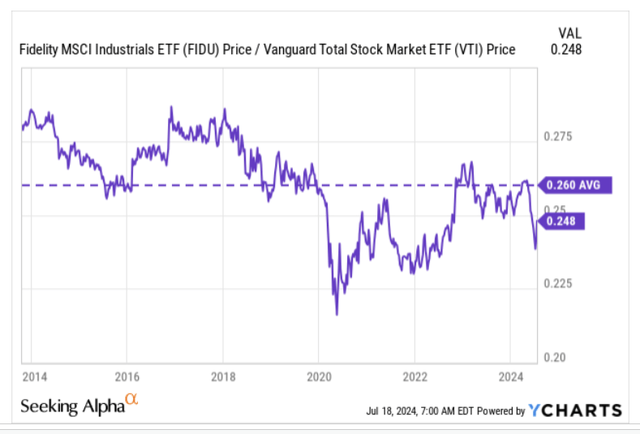
Then, on the relative strength (RS) charts, we don’t see a massive incentive to rotate into industrial stocks. Yes, the RS ratio of industrial stocks vs. the broader markets is currently slightly below its long-term average, but the difference is not meaningful at less than 5%. More so, industrial stocks are hardly cheap, priced at a P/E of almost 21x. It’s difficult to shed out a premium multiple like that when you realize that industrial stocks are likely to deliver one of the weakest earnings performances during the ongoing Q2 earnings season (only the materials sector has a poorer outlook)
Factset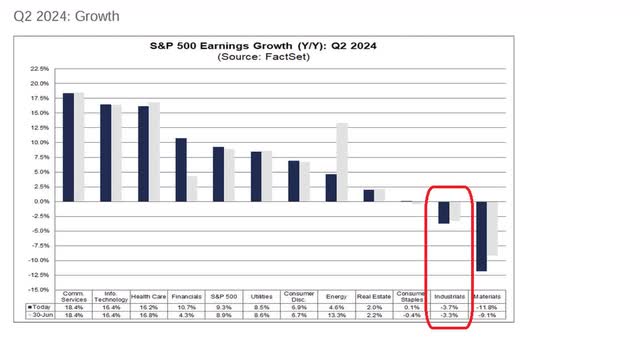
Finally, if we look at FIDU’s monthly chart, it is difficult to get too enthusiastic about initiating a long position when the product is now at lifetime highs. In addition to that, it also looks like the ETF has been forming something akin to a rising wedge pattern, which runs the risk of reversing at higher levels.
Investing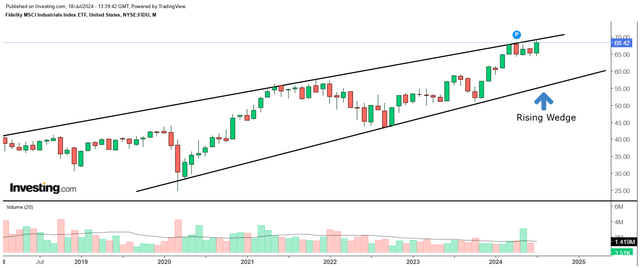
To conclude, we don’t believe FIDU would make a good BUY now.
Read the full article here


")


")