")


")

")
Momentum investors make the bold assumption that if a stock price is trending higher, there is a reasonable degree of certainty that it should continue moving upwards unhindered in the near future. Though simplistic, this is an assumption that can definitely translate into solid returns, but only if it is treated cautiously and the strategy is applied timely. Here, the simplest and perhaps most convenient way is to stick with an ETF that has a strategy built around the concept of momentum instead of engaging in individual stock picking. And investors are not short of options to choose from. One of the vehicles that offers exposure to the said factor is the Fidelity Momentum Factor ETF (NYSEARCA:FDMO), which I would like to add to my coverage list today.
FDMO does a lot of things right, looking beyond share price performance and adding EPS surprises and short interest to the momentum factor mix. And with such a nuanced strategy, it is still fairly competitively priced, with an expense ratio of only 15 bps. However, I would like to present a mostly neutral review of FDMO, as there is something to dislike about its past performance.
What is FDMO’s strategy?
As we know from its website, FDMO is managed passively, with the cornerstone of its strategy being the Fidelity U.S. Momentum Factor Index. A thorough review of the security selection process is provided in the methodology document available on the Fidelity website. Here, I would like to focus on the key facts only. The starting point is 1,000 U.S. companies with the largest market caps. Like in the case of other Fidelity factor indices that I have discussed in the past, for instance, the Fidelity U.S. Quality Factor Index, the composite factor score is the nucleus of the selection process. In the case of the momentum index, it has four elements. The first one is the “12-month Return Minus 1-month Return,” with a 35% weight in the CFS. Exactly the same weight is allocated to the “Volatility-adjusted 12-month Return Minus 1-month Return.” What I especially like about this strategy is that it is based not only on price appreciation (i.e., a return delivered over a specific period) and volatility but also on metrics like “12-month Earnings Surprise” and “12-month Average Short Interest,” both with a 15% weight. These ingredients add a layer of quality to the methodology.
With the CFS ready, the complicated index construction process follows:
Index construction is an iterative process of combining the composite factor score, size adjustment, security selection and security weighting.
It is not to be overlooked that this strategy incorporates the principle of sector neutrality. Thus, it is reasonable to expect the sector weights not to substantially differ from those in the Russell 1000 or the S&P 500. This is not unique to FDMO, as there are other momentum ETFs that adhere to a similar sector weighting schema. One of the examples is the JPMorgan U.S. Momentum Factor ETF (JMOM) that I covered in March 2023.
What returns has FDMO been capable of delivering?
FDMO’s performance since its inception has not been spectacular, but nuances emerge depending on the period selected.
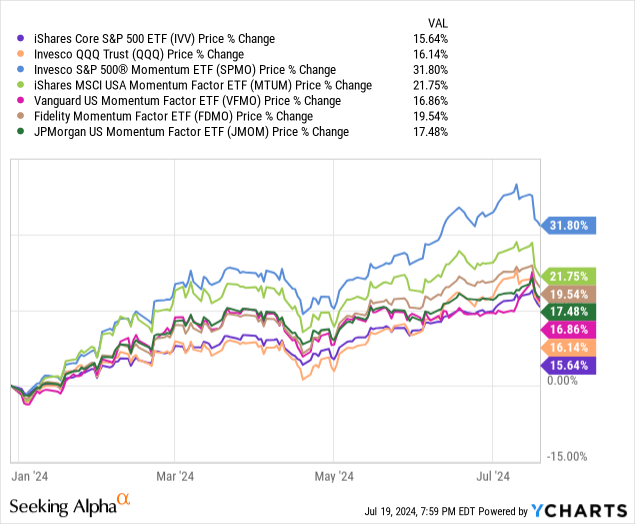
For instance, this year, as the market has been bidding up multiples for tech bellwethers thanks to the AI narrative and the resilient economy balanced with encouraging trends in inflation that are supportive of the first interest rate cut, perhaps as soon as September already, and despite some softness of late, FDMO has delivered a 19.5% price return. So it has solidly outpaced the iShares Core S&P 500 ETF (IVV) together with the Invesco QQQ Trust ETF (QQQ) as well as a few peers, including the JPMorgan U.S. Momentum Factor ETF (JMOM), the Vanguard U.S. Momentum Factor ETF Shares (VFMO), and the iShares MSCI USA Momentum Factor ETF (MTUM). In the group selected, the Invesco S&P 500 Momentum ETF (SPMO) has been unrivaled.
While robust this year, when placed in a broader context, FDMO’s total returns look much less appealing. More specifically, over the October 2016–June 2024 period (FDMO was incepted in September 2016), it underperformed IVV, QQQ, and two peers, namely MTUM and SPMO.
| Metric | FDMO | MTUM | SPMO | QQQ | IVV |
| Start Balance | $10,000 | $10,000 | $10,000 | $10,000 | $10,000 |
| End Balance | $27,122 | $27,718 | $35,602 | $42,694 | $28,848 |
| CAGR | 13.74% | 14.06% | 17.80% | 20.60% | 14.65% |
| Standard Deviation | 16.58% | 17.19% | 16.97% | 19.47% | 16.26% |
| Best Year | 25.29% | 37.50% | 33.86% | 54.85% | 31.25% |
| Worst Year | -19.32% | -18.26% | -10.46% | -32.58% | -18.16% |
| Maximum Drawdown | -22.75% | -30.16% | -21.35% | -32.58% | -23.93% |
| Sharpe Ratio | 0.75 | 0.74 | 0.94 | 0.97 | 0.81 |
| Sortino Ratio | 1.18 | 1.18 | 1.6 | 1.59 | 1.24 |
| Benchmark Correlation | 0.96 | 0.89 | 0.88 | 0.92 | 1 |
| Upside Capture | 91.51% | 92.6% | 99.94% | 123.6% | 100% |
| Downside Capture | 93.98% | 94.64% | 86.87% | 107.22% | 100% |
Data from Portfolio Visualizer. IVV was selected as a benchmark
The next period is March 2018–June 2024, selected as VFMO has the shortest trading history.
| Metric | FDMO | MTUM | SPMO | QQQ | VFMO | IVV | JMOM |
| Start Balance | $10,000 | $10,000 | $10,000 | $10,000 | $10,000 | $10,000 | $10,000 |
| End Balance | $21,099 | $19,182 | $25,908 | $29,951 | $20,771 | $22,406 | $21,589 |
| CAGR | 12.51% | 10.83% | 16.22% | 18.91% | 12.23% | 13.59% | 12.92% |
| Standard Deviation | 17.95% | 18.51% | 18.28% | 21.08% | 20.68% | 17.66% | 18.56% |
| Best Year | 25.29% | 29.85% | 33.86% | 54.85% | 31.36% | 31.25% | 29.20% |
| Worst Year | -19.32% | -18.26% | -10.46% | -32.58% | -12.82% | -18.16% | -20.84% |
| Maximum Drawdown | -22.75% | -30.16% | -21.35% | -32.58% | -22.06% | -23.93% | -26.46% |
| Sharpe Ratio | 0.63 | 0.53 | 0.8 | 0.83 | 0.56 | 0.69 | 0.63 |
| Sortino Ratio | 0.98 | 0.83 | 1.33 | 1.34 | 0.87 | 1.05 | 0.98 |
| Benchmark Correlation | 0.96 | 0.9 | 0.89 | 0.93 | 0.9 | 1 | 0.96 |
| Upside Capture | 90.28% | 86.24% | 98.09% | 123.15% | 95.27% | 100% | 96.65% |
| Downside Capture | 93.83% | 96.14% | 88.91% | 109.53% | 99.91% | 100% | 100.13% |
Data from Portfolio Visualizer. IVV was selected as a benchmark
Over this period, only one momentum ETF was capable of outperforming the market, and it was SPMO. FDMO underperformed IVV, QQQ, JMOM, and SPMO.
FDMO factor mix: high-beta quality stocks with solid growth characteristics
FDMO has an equity basket rich with momentum names that are sporting solid growth and size premia. Value stocks have minuscule weights, which is no surprise. IT names account for more than 30% of the net assets.
| Sector | FDMO |
| Information Technology | 30.3% |
| Financials | 13.2% |
| Health Care | 12.1% |
| Consumer Discretionary | 10.2% |
| Industrials | 9.1% |
| Communication | 8.5% |
| Consumer Staples | 5.7% |
| Energy | 3.7% |
| Real Estate | 2.5% |
| Materials | 2.4% |
| Utilities | 2.1% |
Prepared by the author using data from FDMO and the iShares Core S&P Total U.S. Stock Market ETF (ITOT)
Momentum and volatility
More specifically, as of July 17, FDMO had a portfolio of 125 common stocks, with the cohort of the main ten names accounting for 34.3% of the net assets. My calculations show a weighted-average 24-month beta coefficient of 1.18, indicating that most holdings are significantly more volatile than the market. As the average figures illustrate, the top contributors here are the consumer discretionary and IT sectors, while health care and utilities are the main detractors.
Created by the author using data from Seeking Alpha, FDMO, and ITOT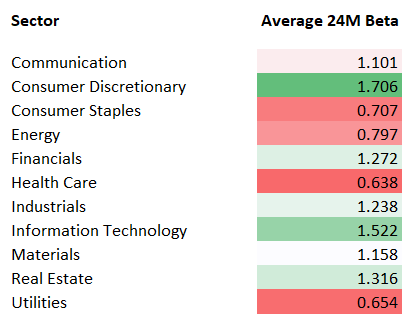
At the same time, as of July 18, over 87% of the holdings had a B- Quant Momentum grade or higher, indicating the strategy is truly capable of selecting market darlings.
Growth and value
FDMO has meaningful exposure to the trillion-dollar companies, as they account for about 24.3% of the portfolio, so its massive weighted-average market cap of $795.8 billion is no surprise. Though fairly compressed at 3.4%, its weighted-average adjusted earnings yield (loss-making companies were ignored) chimes relatively well with a 24.6% forward EPS growth rate, as per my calculations. Price/Sales is expectedly elevated at 9.7x, as NVIDIA (NVDA), a high-P/S, high-growth bellwether, has a 6.9% weight in this portfolio. NVDA is the primary contributor to the 15.8% forward revenue growth rate. From a Quant perspective, the portfolio is expectedly richly priced as well, since 85.7% of the holdings have a D+ Valuation grade or worse.
Quality
FDMO has solid quality characteristics, with little to criticize.
| Metric | FDMO |
| Quant Profitability B- or higher | 93.4% |
| Quant Profitability D+ or lower | 4.8% |
| Adjusted ROE | 23.8% |
| ROA | 13.1% |
Calculated by the author using data from Seeking Alpha and the ETF
Return on Assets is comfortably above the 10% level that I consider desirable, while the adjusted Return on Equity (negative, triple-, and four-digit figures were filtered out) is confidently above 20%.
Earnings-wise, only around 9% of the companies represented undershot analysts’ consensus EPS estimate in the last quarter, while 75.4% have excellent or close to excellent (B- or better) Quant EPS Revisions grades.
Final thoughts
FDMO does a lot of things right, with its major strength being the addition of EPS surprises and short interest to the composite factor score that is used to calibrate its underlying index. In this regard, it might deserve attention from momentum investors, but a Buy rating is still unjustified, as its past performance was rather mixed, with no clear edge over competitors or the S&P 500 ETF.
Read the full article here
")

")


