Investment briefing
At the end of Q3 2023, our research pointed to the utilities sector as an attractive risk/reward calculus for the proceeding 12 months (Figure 1). Now firmly into the next earnings cycle, FactSet analysis has found that 5 from 11 sectors have reported Q4 2023 numbers to date, with utilities among the leaders in earnings growth, along with communications and consumer discretionary.
Figure 1.

The case is bolstered by the fact the utilities sector trades at a median 16x forward earnings, 18.6x forward EBIT and presents with a 14% cash flow yield and c.5% trailing dividend yield.
Comparatively, the electric utilities sector falls within the broader utilities domain and trades at a median 14.8x forward earnings and 11x EBIT, presenting with a similar cash flow yield. Given the points raised thus far, our top down security selection in Q1’23 has honed in on electric utilities names.
Figure 2. Electric Utilities Industry Key Ratios
Source: Bloomberg Finance LP, Bernard Investment Group 2023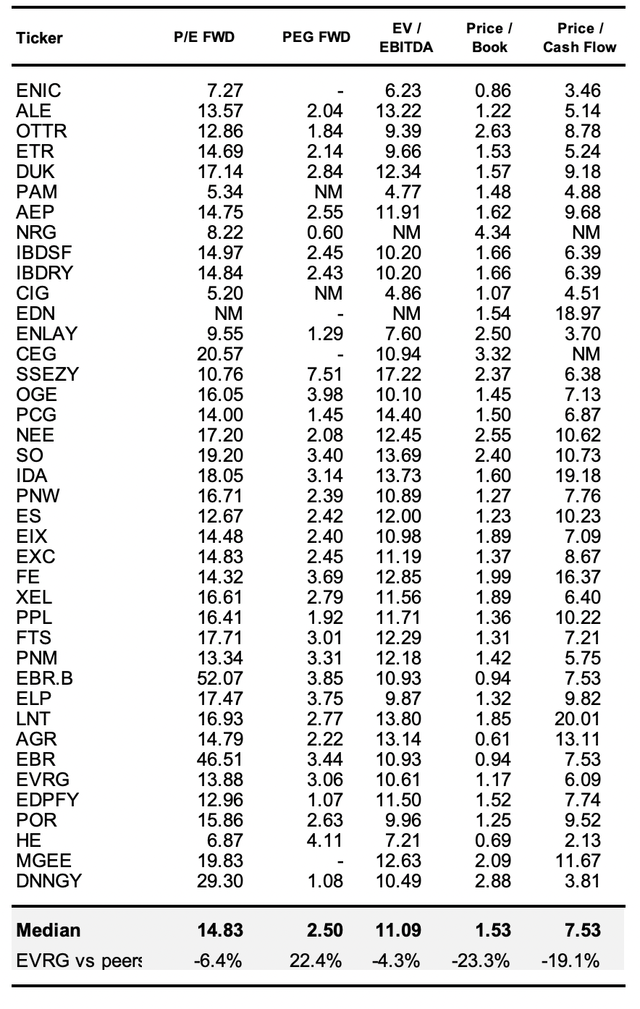
Investor keen on allocating to electric utilities faces a myriad of challenges to compound their equity holdings. The following critical factors are relevant:
- There is no differentiation in product of price for the suppliers of electricity. It is all the same ‘product’, and prices are more or less determined by the market, even when offtake agreements are in place.
- As such, the low-cost providers typically shine, possessing production advantages that allow them to produce output at a lower marginal cost and/or with lower incremental capital requirements.
- We therefore typically see flourishing companies in the space produce a high ratio of sales to assets in the company, indicating efficient capital investments made into the business. Rarely, are benefits seen at the margin-this relates back to point (1), whereby the post-tax margin per $1 of invested capital is low.
- The exception to the rule here is in the renewables space. These do differentiate on product and price and therefore can price their offerings above industry peers, thereby realizing higher margins after tax. But the issue is, the capital invested is typically inefficient, meaning the capital turnover is <$1 in sales for every $1 invested.
Consequently, when we observe high post-tax margins in any electrical utilities company, we are keen to find out why.
Such a journey brought us to the equity holdings of Evergy, Inc. (NASDAQ:EVRG).
EVRG is positioned at multiple points upstream and downstream of the energy market. It is involved in the production, transmission, distribution, and commercialization of electricity in both Kansas and Missouri within the US.
The company’s electricity generation is fueled by a diverse array of sources, including coal, hydroelectric, landfill gas, uranium, natural gas, oil, and a growing portfolio of renewable sources such as solar and wind.
Despite many positive factors in the investment debate, including starting valuations and dividends, there are multiple compressors to the company’s earnings power and asset factors in our view. Net-net, we rate EVRG a hold, looking for more selective opportunities elsewhere.
Critical investment facts to hold rating
There are balancing factors on both sides of the investment calculus for EVRG. In our opinion, none are more outweighing the other, supporting a neutral view. The arguments for the hold rating on EVRG are outlined below in comprehensive detail.
Starting with the positives:
1) Dividends
As seen in Figure 3, the company’s dividend payment has increased from a rate of around $0.19 per quarter per share in 2003 to a rate of $0.64/quarter in Q3’23. This is certainly a positive from the perspective of the income orientated investor. The growth in dividend income is clearly being a source of positive return for the company’s longer-term shareholders, in lieu of the price returns. For those investors seeking income and/or yield only, various potential merits in owning EVRG at 14x forward earnings.
Figure 3.
Source: Seeking Alpha
2). Starting valuations
As mentioned earlier the company sells at 14x forward earnings which adjusts to 3x when factoring in forward growth assumptions. The former is around 14% discount to the sector, whereas the company’s 5% trailing dividend yield is around 22 percentage points higher than sector median.
As a reminder, investment returns in the first 12 months after the purchase of any listed security are heavily dependent on the starting multiples paid for the asset.
In that vein, there is scope to buy EVRG at these compressed multiples for a statistical advantage in is thank you yeah I just the ladies anybody know what it was then either yeah yeah sorry yeah you somewhat that is it of price appreciation over the coming 12 months in our opinion. However, this does not align with a long-term investment strategy, and thoughtful judgement must be made on the quality of the assets and earnings to which the market has rated the company so lowly.
Now to the balancing factors:
1). Capital Inefficiency
Whilst the prices EVRG is currently commanding in the market are invariably cheap, we must also accept that the market is a fairly accurate charge of value in the long run. It may be just, lowly valued.
It’s also worth noting that the company is priced at around 1x book value. In other words, it has created no value above its cost of equity. It has created no additional shareholder value in other words.
Critical analysis of the numbers reveals why:
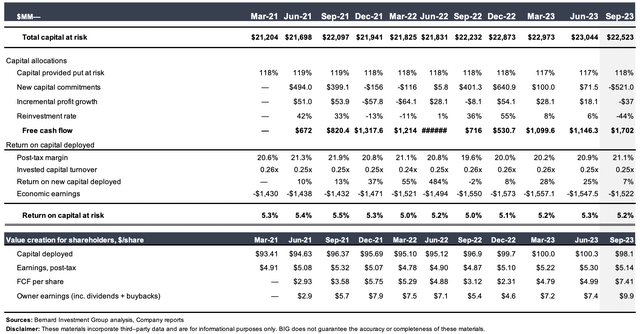
- The company had invested $98 per share of investment or capital into the business by the end of Q3 last year. On this amount, it produced a trailing $5.14 in earnings after tax, just a 5.2% return on capital. Keep in mind that for the bolus the preceding 12 months, short rates were at 4-5%, and the long end of the curve was yielding a similar amount in income. Considering the added risk in owning the equity stock of EVRG above securities producing a similar return on capital with lower perceived risk, this is not an acceptable result for the equity investor.
- On an incremental basis, the numbers aren’t any better. From the period of Q1 2021 to Q3 last year, the company had invested an additional $5 per share of capital into the business to maintain its competitive position. In the same period, earnings have increased from $5.08 per share to $5.14 per share, marking just a 1.6% return on incremental capital over this time. Given that stock returns closely followed business returns over an extended period, this game is not an unacceptable result for the investor seeking outsized returns relative to the equity benchmark.
One factor that does stand out is that EVRG is in possession of abnormally high post-tax margins for this industry. This is quite remarkable. Is certainly not normal to observe such high margins in an electric utilities company as mentioned in the introduction of this report. However, this is immediately balanced by the fact the company’s capital produces only $0.25 in sales per dollar of investment. This is tremendously inefficient, especially for such a capital-intensive business that requires an investment of $22.5Bn at risk in the business in order to conduct its operations. This supports the neutral view in our opinion.
Figure 4.
2). Highly leveraged, severely clamping free cash flow production
For what it’s worth, EVRG is free cash flow positive and has grown the cash it has available to invest or return to shareholders quite an amount over the last 2 to 3 years. For instance, free cash flow per share before any interest payments have increased from a trailing $2.93 up to $7.41 in the last period, although has averaged around $3-$4 each period (Figure 4). This is because in Q3 ’23 EVRG realized additional cash flow from a reduction in working capital intensity.
The picture changes when adjusting for the company’s capital structure. The firm is highly leveraged, with around $12.76Bn in debt on the balance sheet. That means around $9.75Bn of equity is holding up around c.$30Bn in gross asset value, a 3x multiplier on shareholder equity. Consequently, the company is highly leveraged and this has implications for net-net free cash flow production.
Figure 5 illustrates this in great detail. It shows the company’s net operating profit after tax, adjusted for the tax shield, on a rolling TTM basis. Critically, sequential growth in after-tax operating income has been on the decline since 2021, as pretax earnings have been trending low as well. Here we have approximated the maintenance capital expenditure as the depreciation charge each period, and only considered any investments to grow that capital expenditure or investment cash flow above the maintenance capital charge.
As seen there has been little effort from the company in allocating growth capital. Moreover, the maintenance capital charge to operate the business and maintain the company’s assets has increased from $938mm to $1.1Bn in the last quarter (TTM values). This fits with the macroeconomic narrative, as asset replacement costs have shot up meet the inflationary environment, especially in capital-intensive industries such as utilities.
As a result, whilst cash-free cash flow is still robust for the company it is a markedly different result versus the unleveraged numbers. One can observe the change before and after debt obligations in Figure 6.
Figure 5.
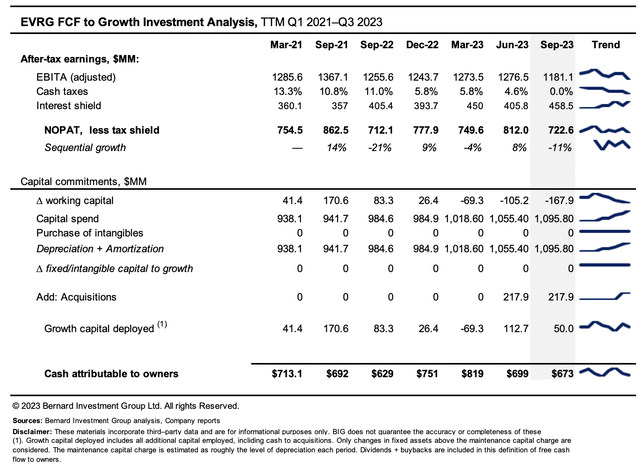
Figure 6.
Source: Bernard Investments, Company reports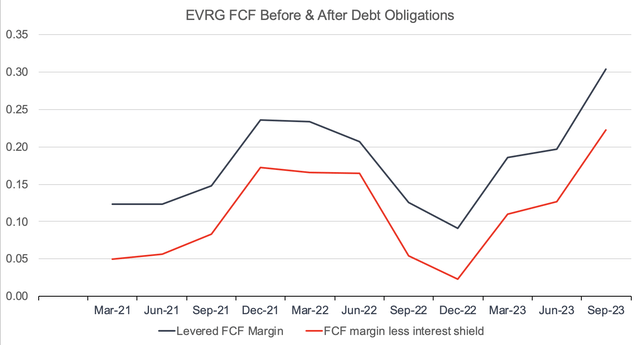
Valuation and conclusion
The stock sells at around 14 times forward earnings as mentioned and is priced at par to the book value of its equity. Consensus estimates have been a reasonable guiding tool to make inferences on EVRG’s earnings trajectory over the past few years. We are therefore aligned with consensus view on the company’s earnings growth assumptions.
At 14x forward earnings estimates of $3.83/share, this gets you to $53.50 per share implied valuation, marginal upside from the price at publication. This is an appropriate evaluation for this company at this point in time in our estimation. There is robust data to suggest EVRG deserves a low multiple, below an already compressed utilities sector. Namely:
(1). Tremendously inefficient capital invested into the business that produces less than $1 in sales per $1 of investment ongoing.
(2). Whilst free cash flow is positive and consistently strong, the firm’s capital structure is a headwind to growth in free cash flow per-share. More than $12.7Bn in debt on the balance sheet means that just $9.75Bn in equity is holding up more than $30Bn assets. Equity holders therefore have little claim over the companies balance sheet.
(3). The company’s dividend payment, whilst potentially attractive at current levels, does not offer the downside protection or upside factors to mitigate the above two points.
It is with these data which we rate EVRG a hold at $53.50/share, equal to around 14x forward earnings of $3.83/share. Investors may realize a 4-5% dividend yield at these prices. Considerations should be made for this. Net-net, rate hold.
Read the full article here

