

")
")

")
Dividends are probably being overlooked by many investors today. Consider that low-yielding Communication Services sector companies are leading the global stock market this year, with gains also seen in the high-growth Semiconductor industry. The Fab 5, Super 6, or whatever you want to call them, it’s clear that a handful of tech-related firms are in the spotlight, leaving blue-chip dividend-paying US equities in the dust. I assert, though, that value remains prevalent among domestic dividend payers.
I reiterate my buy rating on the WisdomTree US Total Dividend Fund (NYSEARCA:DTD). Considering that dividends in the S&P 500 have grown a solid 5.7% annually since 1957, per WisdomTree, high-yield large caps have proven their muster over many market cycles.
Reliable Dividend Growth Among US Large Caps
WisdomTree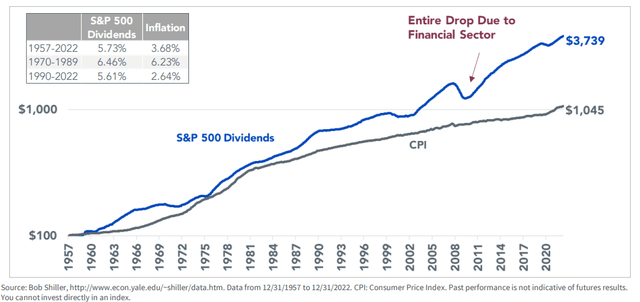
According to the issuer, DTD offers investors exposure to core US all-cap equity from a broad range of dividend-paying companies and the ETF can be used to complement or replace all cap value or dividend-oriented active and passive strategies. The fund seeks to track the performance of the WisdomTree U.S. Dividend Index, by using a representative sampling technique.
DTD is a moderately sized ETF with more than $1.1 billion in assets under management as of February 1, 2024. With a somewhat low 0.28% annual expense ratio, above that of similar broader-based US large-cap index ETFs, DTD earns a strong B+ rating from Seeking Alpha’s ETF Grading System. Share-price momentum has been robust lately, though I will highlight some key technical risks later in the article.
Dividends, meanwhile, are of course highlighted with a yield nearly a full percentage point above that of the S&P 500. Risk metrics are sound, but the liquidity profile is not ideal in my opinion. Total average daily share volume is light at just 42,000, but the fund’s 30-day median bid/ask spread is a bit wide at 11 basis points, so I encourage investors to use limit orders when trading DTD.
Digging into the portfolio, the 4-star, Gold-rated ETF by Morningstar has an allocation that plots across the top third of the style box, indicating that it has a large-cap bent. Look closer, though, and you will find that a chunk of the portfolio is considered mid-cap with even some small-cap access. I like the fact that DTD’s price-to-earnings ratio is less than 16 while its long-term earnings growth rate is about in line with the S&P 500’s historical average, above 9%. That yields a favorable PEG ratio well under 2.
DTD: Portfolio & Factor Profiles
Morningstar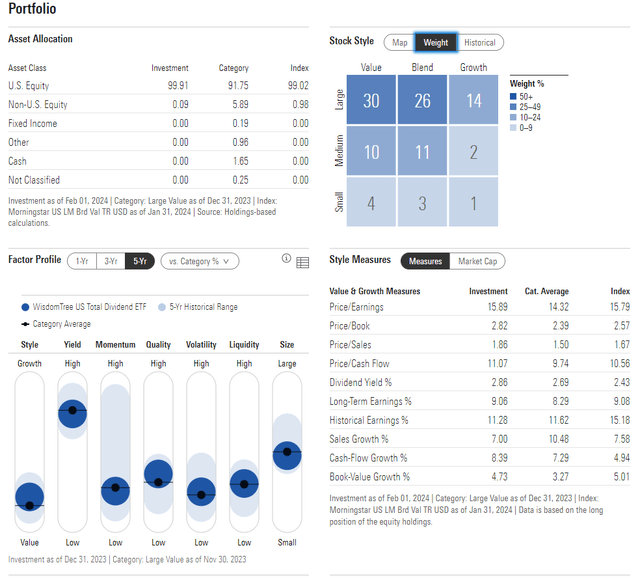
There is a diversification benefit with DTD, too. While the Information Technology sector is close to 30% of the SPX, it’s just 18% of this dividend-focused fund. Financials is fractionally larger than I.T. in terms of the sector breakout.
Overall, there is a solid mix of value and growth sectors with DTD’s asset allocation. Additionally, the biggest weight is Microsoft (MSFT) at 3.2%, less than half of the world’s most valuable public company’s weight in the S&P 500. Apple (AAPL) is the second-largest holding.
DTD: Holdings & Dividend Information
Seeking Alpha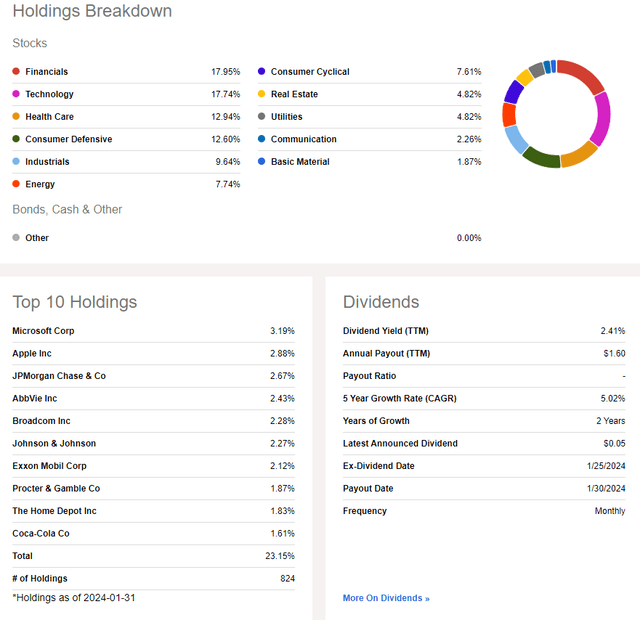
If you haven’t checked out Seeking Alpha’s new Seasonality tool, you must do so. It is great for diversified products like DTD. Here’s how to read the graph below – DTD has historically averaged a decline of 0.1% in February over the last 10 years. March has seen a comparable loss when averaging returns over the last decade. A bullish run then begins at the start of the second quarter and has lasted through July. So, tactical investors might consider holding off on purchasing DTD until later this quarter.
DTD Seasonality: Weak in February & March
Seeking Alpha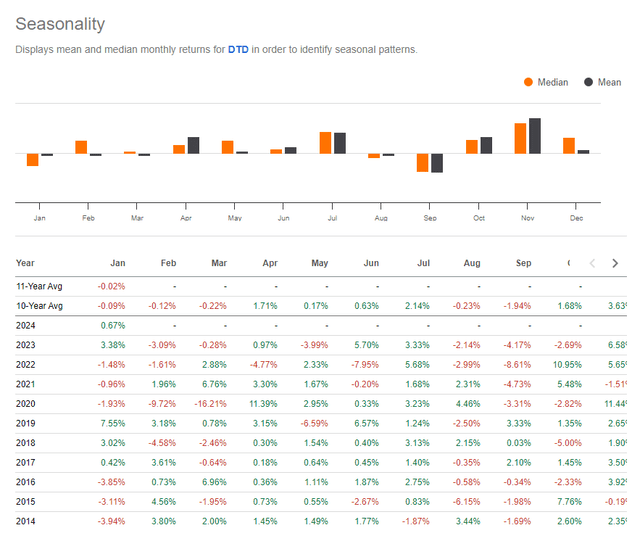
The Technical Take
With a diversified portfolio, attractive valuation, reasonable cost, and somewhat weak seasonality today, the chart is mixed. First, notice in the graph below that shares recently nudged up to fresh all-time highs. But the move came on bearish RSI divergence – a situation in which the RSI momentum oscillator prints a lower high while price hits a new peak. I would like to see an improved momentum reading soon, otherwise bearish seasonality could indeed kick DTD down.
Still, I see support on the chart in the $63 to $65 zone, indicated by the orange line. What’s more, there is a high amount of volume by price from $64 all the way down to $59, so there should be an ample cushion on a pullback. With a long-term 200-day moving average that is on the rise, the trend certainly appears to favor the bulls. Long-term support rests at the October low just under $58.
Overall, the trend is up, but there are near-term cautionary signs.
DTD: Shares Treading Water At New Highs
Stockcharts.com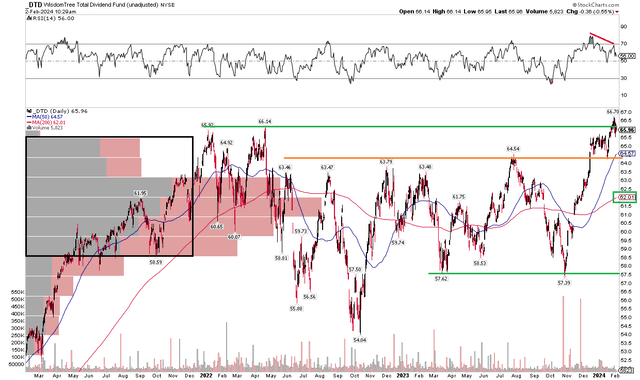
The Bottom Line
I reiterate my buy rating on DTD. I see the portfolio as a solid value with a diversified construction process. Seasonals are weak, though, and momentum on the chart has waned slightly.
Read the full article here


")
")
")
