Intro
Costco Wholesale Corporation (NASDAQ:COST), a retail giant renowned for its warehouse club model, has consistently demonstrated its resilience and financial strength over the years. Over a five-year span, the stock returned more than 250%, easily clearing the S&P 500 in the same time period, which was up 85%. This past year, Costco has handedly outperformed the broader market, returning 42% versus 22% for the S&P 500. In our opinion, the stock likely benefitted from investors flocking to safer, profitable, non-discretionary names amid macro uncertainty and consumer pressures driven by elevated interest rates. We are optimistic about the outlook for 2024, on the other hand, anticipating improved conditions as inflationary pressures subside and with growing expectations that the Fed will implement multiple rate cuts throughout the year. Consequently, we anticipate a shift in investor preferences towards more growth-oriented and riskier stocks as the year unfolds, which may pose challenges for Costco. Undoubtedly, Costco is an exceptional company, known for its customer loyalty, efficient supply chain, and strong value proposition, with its membership-based model leading to robust customer retention. Despite these strengths, caution may be warranted for potential investors at this moment, with current valuation levels suggesting that now might not be the optimal time to buy Costco stock. While we acknowledge COST’s excellent financial performance and strong competitive edge, on a valuation basis, we believe that the stock is currently overbought and overvalued. We assign Costco a Hold rating and price target of $611, suggesting 10% downside from current share price levels, and we believe there is room for an ever bigger correction in the coming months.
Financial Performance
No doubt, Costco is a well-run business with several economic moats, making it a sure thing for long-term investors. In its most recent quarter, the company grew its top-line by ~6% y/y, healthy growth given the maturity of the business, and both its operating and net income margins expanded by 21 and 24 basis points y/y, respectively. In Figure 1 below, we also highlight that COST continues to grow its same store sales, albeit at a decelerating rate, demonstrating its ability to retain its members and attract new members to its warehouse locations.
Figure 1 (Loft Capital Mgmt., Company Filings)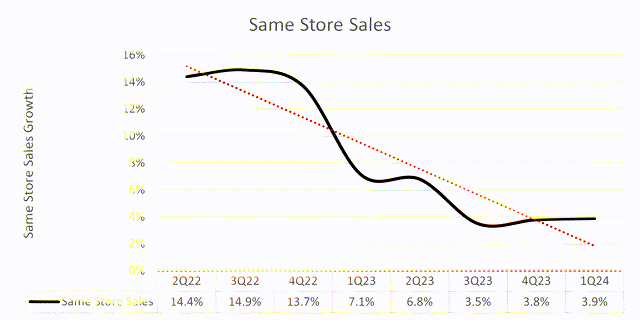
Along those lines, COST continues to grow its membership income, which increased ~8% y/y in its most recent quarter, and its paid members, which also grew ~8% y/y and just over 1% sequentially, to 72 million. In its most recent quarter, membership income represented nearly 70% of COST’s bottom-line, and, given that COST has a membership renewal rate of ~93%, it is clear that the company has an unrivaled ability to consistently generate strong profits and free cash flow. See Figure 2 below for trends involving Costco’s membership income and paid members.
Figure 2 (Loft Capital Mgmt., Company Filings)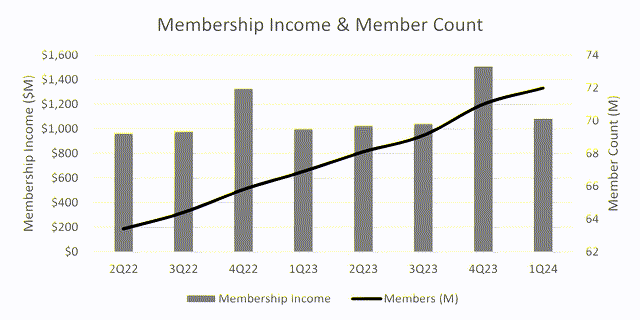
Further, COST continues to grow its warehouse footprint, which should lead to both member growth and top-line expansion in outer years. As of its most recent quarter, COST had 871 warehouses worldwide, and 82.6 thousand members per store, an increase of 4.5% y/y. We view members per store as an important metric to monitor as its growth demonstrates COST’s ability to not only retain current members, but also win new members at new and existing locations. See Figure 3 below.
Figure 3 (Loft Capital Mgmt., Company Filings)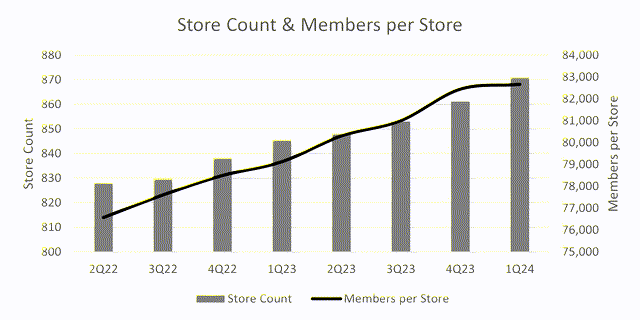
A major growth catalyst for COST going forward will be international expansion, as more than 70% of its TTM revenue was generated in the United States, per Figure 4 below. Overall, we remain optimistic about COST’s ability to continue expanding outside of North America, particularly in Mainland China, where it just opened its first warehouse in the southern region, which enjoyed massive success. COST’s international expansion should continue to open doors for investors who have an appetite for growth, alongside COST’s strong profitability profile.
Figure 4 (Loft Capital Mgmt., Company Filings)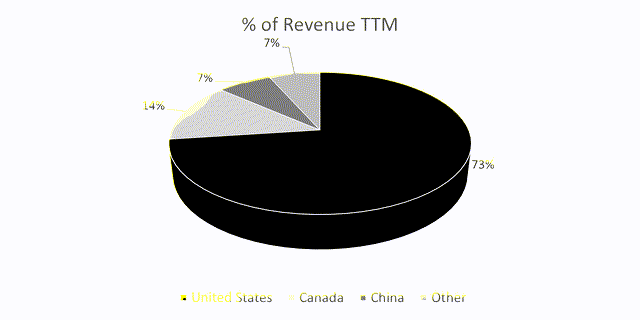
From 2019-2022, COST grew its top- and bottom-line at a CAGR of 14% and 17%, respectively, which is quite impressive given the magnitude of the business. Forward estimates have been largely stable over the past year, as there are not a lot of puts and takes that go into COST’s business running efficiently. From 2022-2025, analysts are estimating the company’s revenue to grow at a CAGR of 6%, indicating decelerating growth, though we point out again that such growth is relatively solid given COST’s maturity within the market it operates. Further, analysts are forecasting the company’s bottom-line to expand at a CAGR of 9% from 2022-2025, which, again, we view as strong growth overall despite representing a notable deceleration. See Figure 5 below for a summary of consensus estimates for COST’s revenue and net income through 2026. Overall, while we view COST’s growth prospects as solid even in spite of both top- and bottom-line deceleration, we do think, coupled with its elevated valuation (which we will touch on shortly), that there are better investment opportunities out there today.
Figure 5 (Loft Capital Mgmt., Seeking Alpha)
Ratings & Valuation
The heart of our thesis that COST is not a great stock to buy today is primarily rooted in its elevated valuation. To start off, we take a look at the company’s P/E ratio; COST is currently trading at ~41x, roughly 21% above its five-year average of ~34x. We point out that while COST’s P/E is high given the market it operates in, we do believe, due to its competitive moat, strong fundamental profile, and how the stock has historically traded, that it does deserve to trade at a premium valuation. Even so, in a historical context, COST appears quite expensive today.
Figure 6 (Loft Capital Mgmt., YCharts)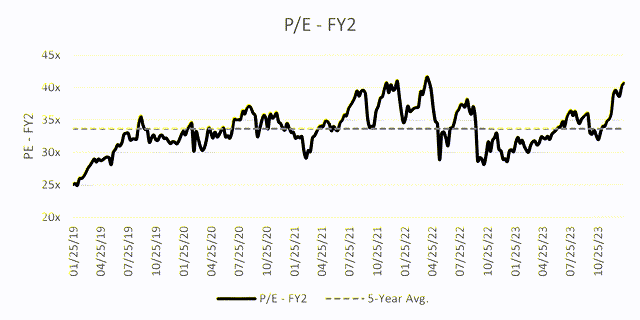
Versus peers, COST is trading at a significant premium, with its P/E multiple 140%+ above its comp average of ~16x. While we believe it’s important to monitor where COST is trading relative to its competitors, we do take its premium multiple versus the comp group somewhat as a grain of salt given where it has historically traded. However, we highlight again that COST is trading well above its five-year average P/E ratio.
Figure 7 (Loft Capital Mgmt., Seeking Alpha)
We estimate COST’s 2025 adjusted EPS to reach $17.45, ~2% above consensus, and, by applying a target multiple of ~35x, largely in-line with COST’s five-year average, we arrive at a price target of $611, suggesting ~10% downside from current share price levels. Our multiple reflects a 120%+ premium to the comp group, which we argue is more than reasonable given COST’s historical multiple, which we view as a better indicator of where the stock should trade going forward.
Figure 8 (Loft Capital Mgmt.)
Below, we provide a scenario analysis for our price target using different assumptions for 2025 earnings growth and our target multiple. We point out that even if COST grows its earnings by 17.5% by 2025, versus consensus of 10% growth, and we apply a target multiple of 45x, well above its five-year average, we arrive at a price target with just 22% upside. Given that such growth rate and multiple are highly unreasonable in our view, we believe the current risk/reward ratio for COST is skewed toward the risk side. As a result, we believe there are plenty of better investment opportunities out there today.
Figure 9 (Loft Capital Mgmt.)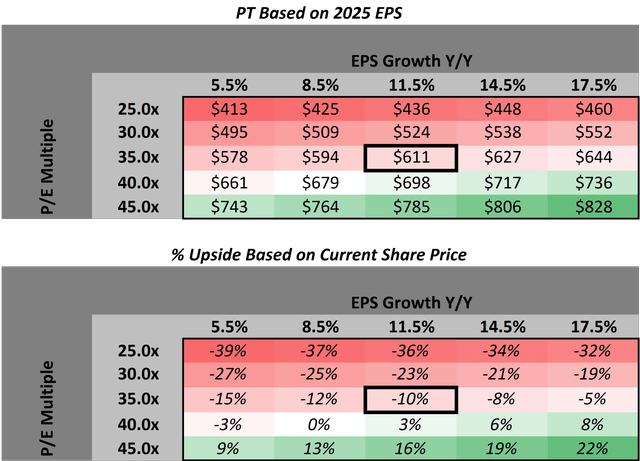
To support our thesis, we take a look at COST’s current RSI. For additional context, RSI stands for Relative Strength Index and is used to identify overbought or oversold stocks, providing insights into potential trend reversals. A high RSI value (usually above 70) suggests that an asset may be overbought, signaling a potential reversal or correction, while a low RSI value (usually below 30) suggests that an asset may be oversold, indicating a potential buying opportunity. COST currently has an RSI of 78, just below its five-year maximum of 83, which indicates to us that the stock is overbought and could be due for a correction. While we value pure fundamental analysis over technical indicators like RSI, we do view the metric as helpful when trying to establish a good entry/exit point for investors. In Costco’s case, we view its current RSI as a good exit point for shorter term investors, or at the very least, an indication that investors should not buy the stock at this time. See Figure 10 below.
Figure 10 (Loft Capital Mgmt., YCharts)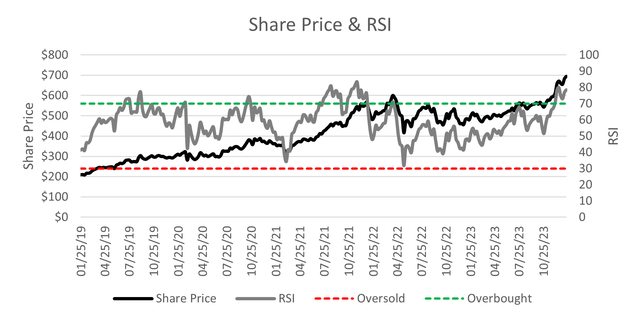
Where Analysts Stand
Per Figure 11 below, we point out that 60%+ of analysts currently have a Buy rating on Costco stock, making our current Hold rating a contrarian viewpoint. We note, however, that despite most analysts rating COST a Buy, the average target price is currently $677, which is more or less where the stock is trading today (little to no upside). This supports our view that there are better investments out there right now that would offer more upside to investors, particularly in the next 12-24 months.
Figure 11 (Loft Capital Mgmt., Seeking Alpha)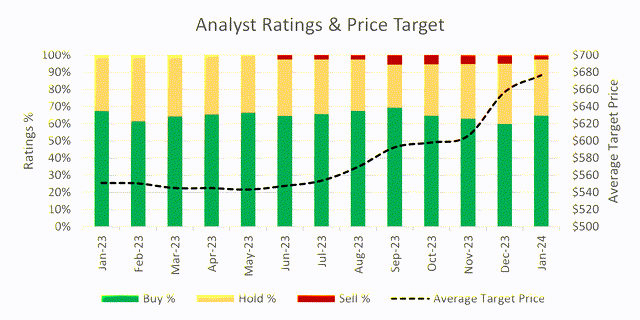
Final Thoughts
COST is trading just 2% off its 52-week high, and, given its decelerating growth prospects and elevated valuation, we believe a correction could be on the table for the stock over the next twelve months. While we reiterate that Costco is a wonderful company with great management, a robust fundamental profile, and a clear competitive moat, we firmly believe that there are better investment opportunities available for investors today. Accordingly, we assign COST a Hold rating and price target of $611, representing ~10% downside from current share price levels.
Read the full article here


