")
")
")

")

The Chicago Fed’s National Activity Index is a monthly indicator designed to gauge overall economic activity and related inflationary pressure. It is a composite of 85 monthly indicators as explained in this background PDF file on the Chicago Fed’s website. The CFNAI is a forward-looking indicator that suggests how the economy will likely look in the near term, and has been called one of the “most important and overlooked economic indicators”. The index is constructed so a zero value for the index indicates that the national economy is expanding at its historical trend (average) rate of growth. Negative values indicate below-average growth, and positive values indicate above-average growth.
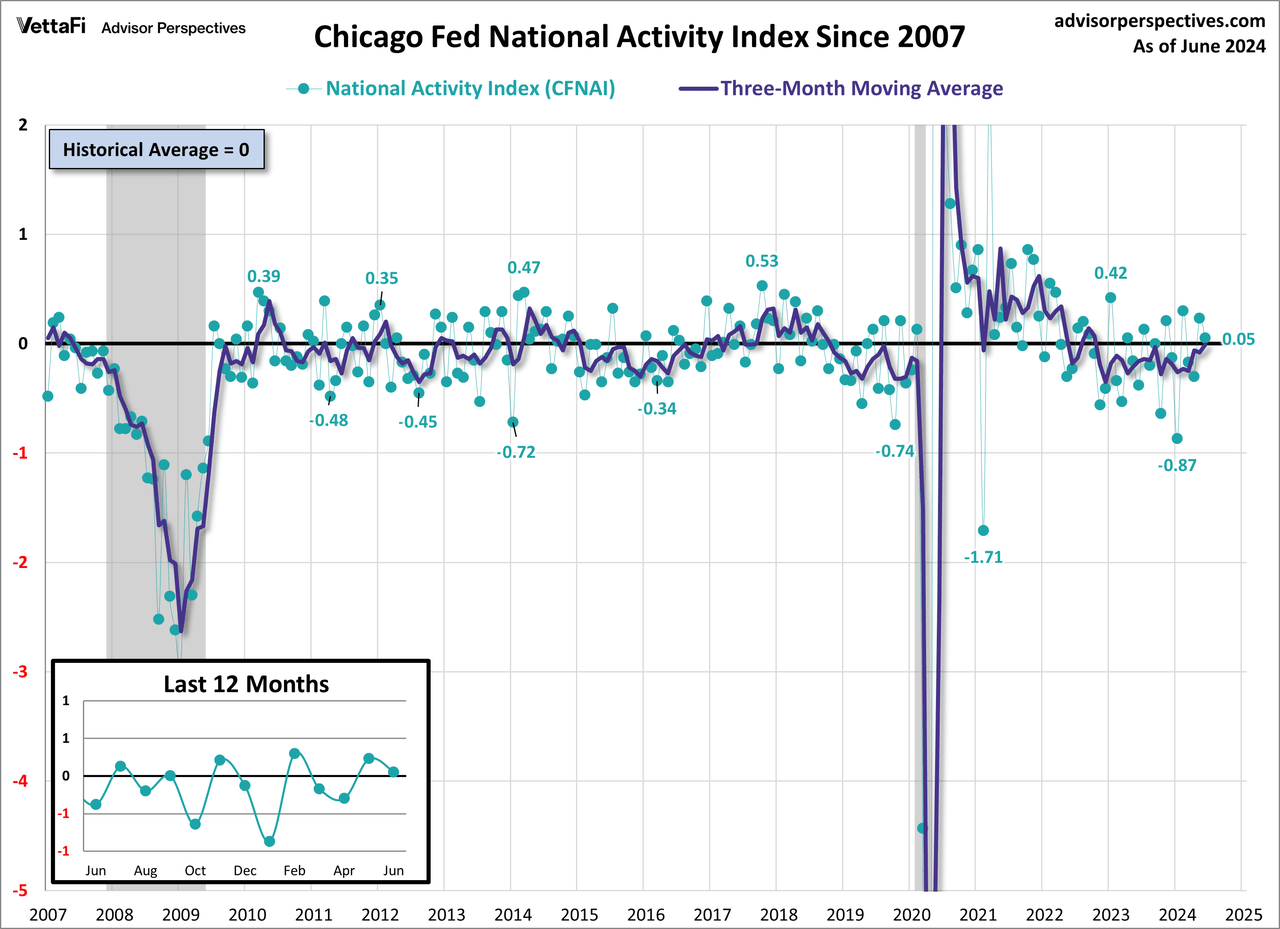
The headline for the latest release of the Chicago Fed’s National Activity Index (CFNAI) reads “Index suggests economic growth decreased in June”. The Chicago Fed National Activity Index (CFNAI) fell to +0.05 in June from +0.23 in May. Three of the four broad categories of indicators used to construct the index decreased from May, and three categories made negative contributions in June.
The first chart below shows the recent behavior of the index since 2007 with a callout to the past year. The green dots show the indicator itself, which is quite noisy. The three-month moving average (CFNAI-MA3) is more useful and consistent as an indicator of the actual trend for economic activity. The index’s three-month moving average, CFNAI-MA3, rose to -0.01 in June from -0.08 in May.
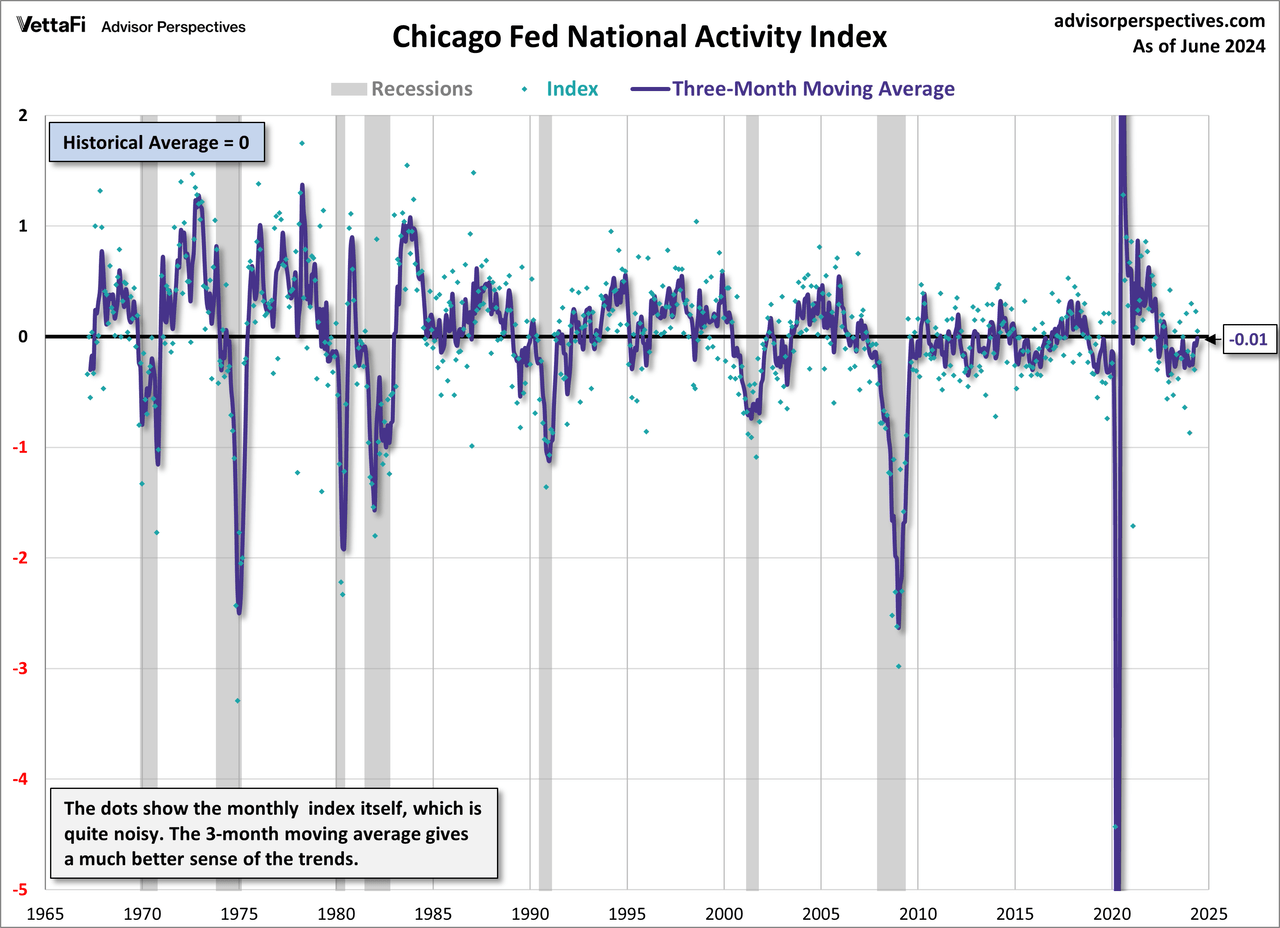
For a broad historical context, here is the complete CFNAI historical series, dating from March 1967.
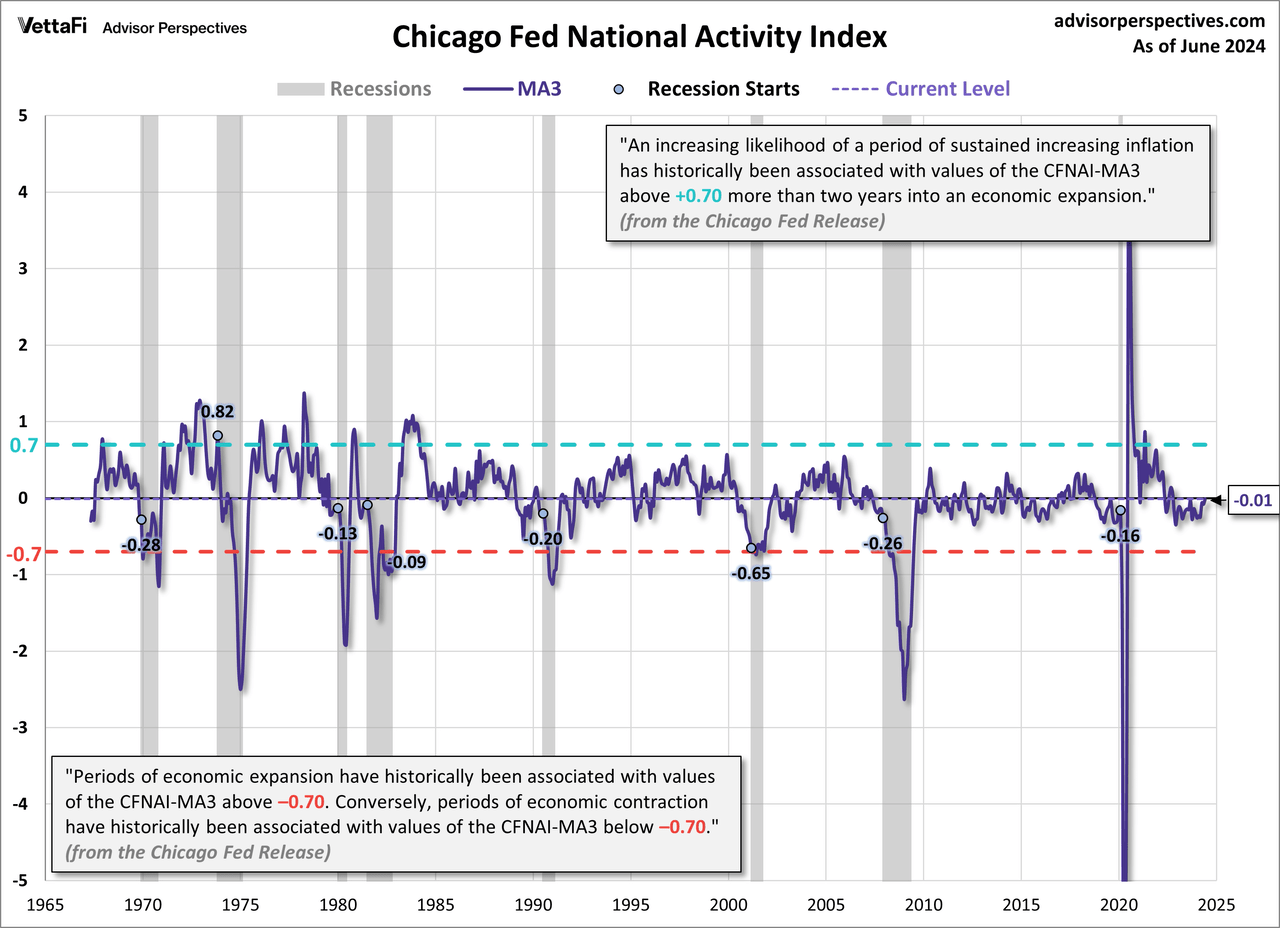
The next chart highlights the +0.7 and -0.7 levels. The two callouts explain the significance of these parameters according to the Chicago Fed.
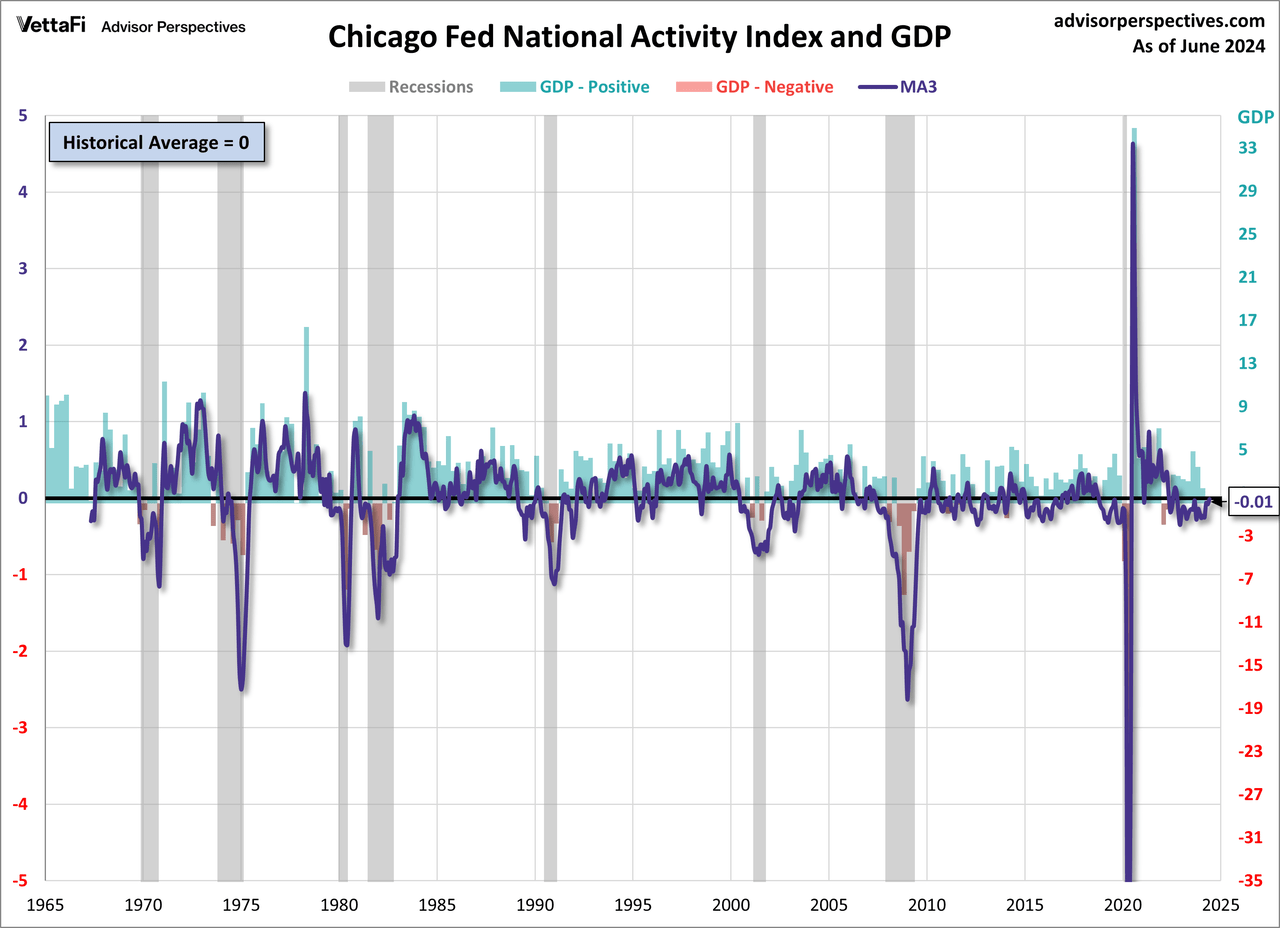
The next chart includes an overlay of GDP. For the most part, the CFNAI-MA3 has been positive while the economy has expanded and been negative while the economy contracts. Surprisingly, this has not been the case for the past year, as we have seen negative readings for the MA3 since November 2022 (with the exception of September 2023) while the U.S. economy has expanded during that same time frame.
CFNAI Volatility
Here’s a chart of the CFNAI without the MA3 overlay – for the purpose of highlighting the high inter-month volatility.
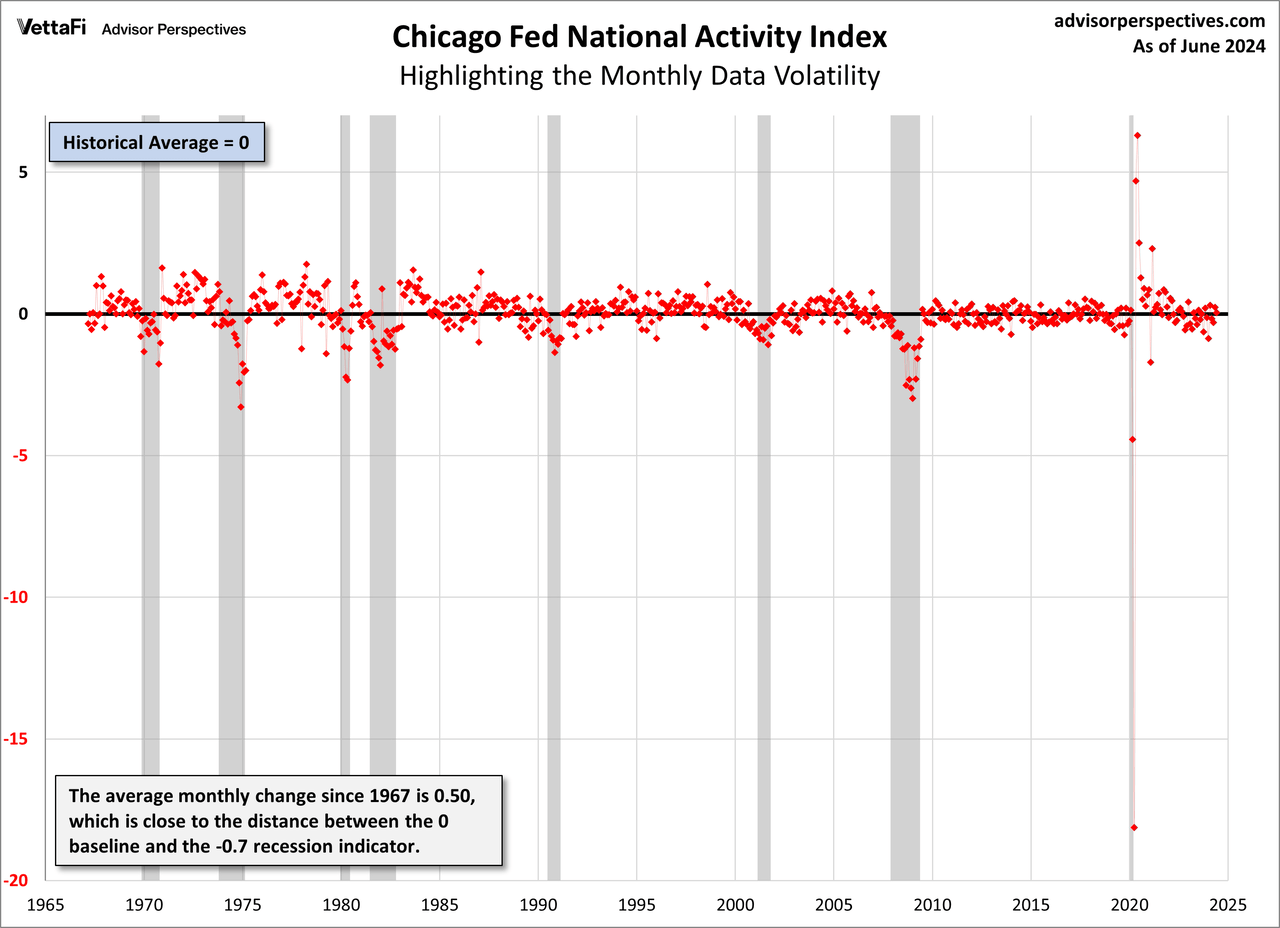
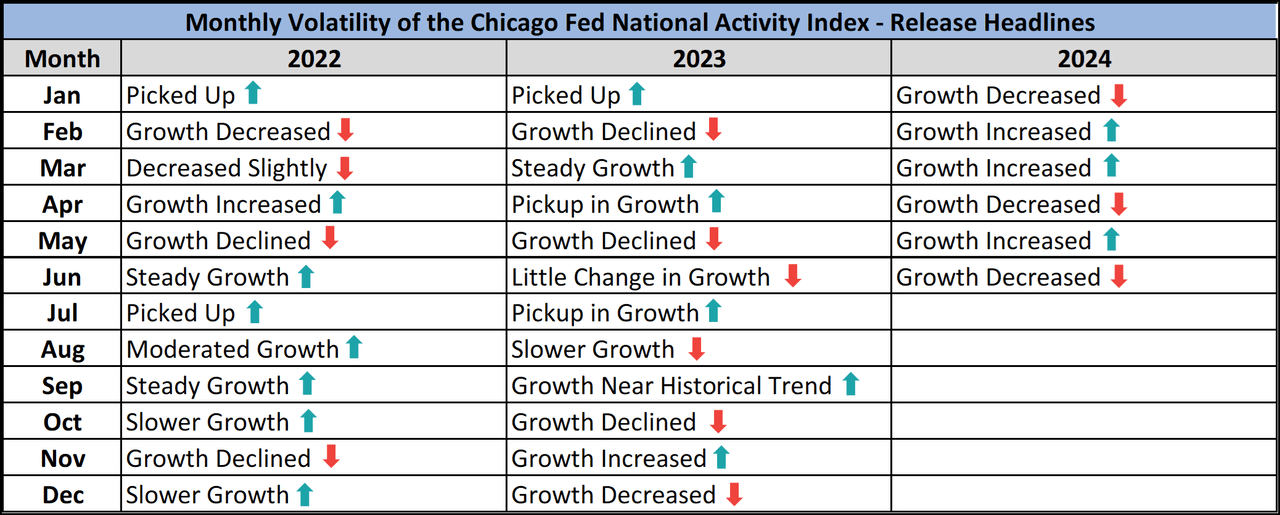
Further underscoring the volatility is the roller-coaster list of CFNAI monthly headlines from the last couple of years.
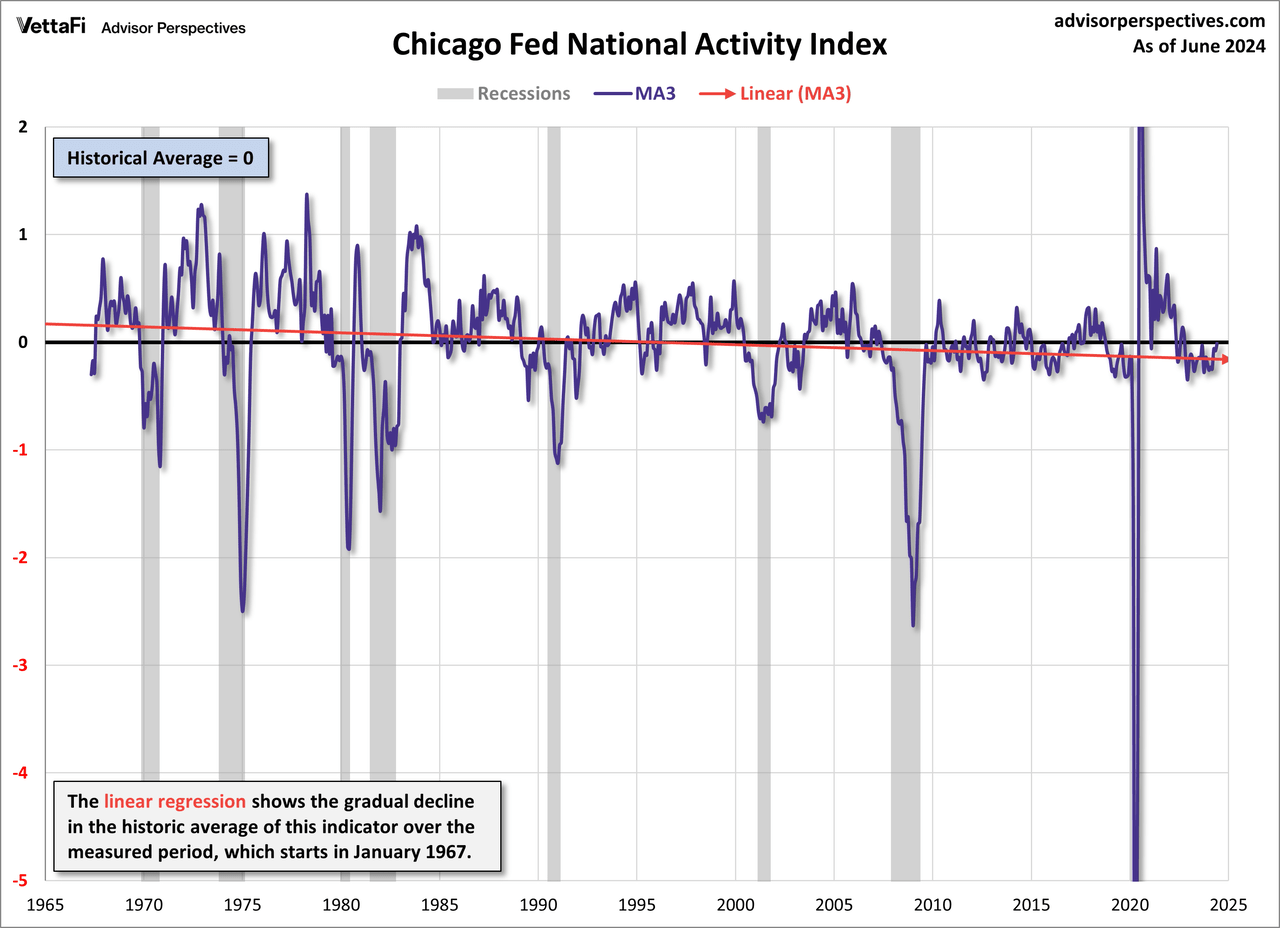
The Long-Term Economic Trend in the CFNAI
In the next chart, I’ve let Excel draw a linear regression through the CFNAI data series. The slope confirms the casual impression of the previous charts that national activity, as a function of the 85 indicators in the index, has been declining since its inception in the late 1960s, a trend that roughly coincides with the transition from a good-producing to a post-industrial service economy in the information age.
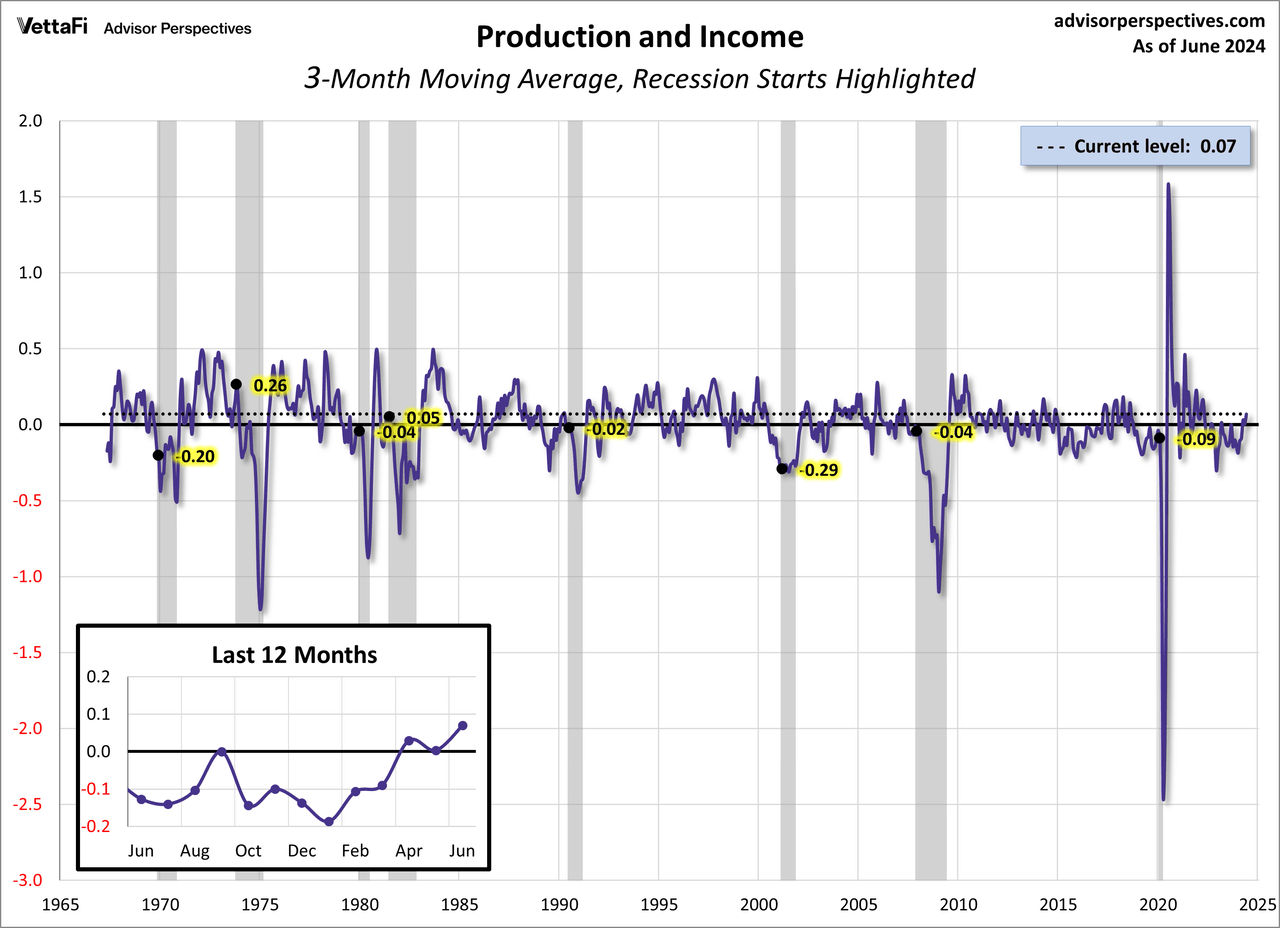
Chicago Fed National Activity Index Component Breakdown
The Chicago Fed’s National Activity Index is based on 85 economic indicators drawn from four broad categories of data:
- Production and income
- Employment, unemployment, and hours
- Personal consumption and housing
- Sales, orders, and inventories
As stated earlier, three of the four broad categories of indicators used to construct the index decreased from May and three categories made negative contributions in June.
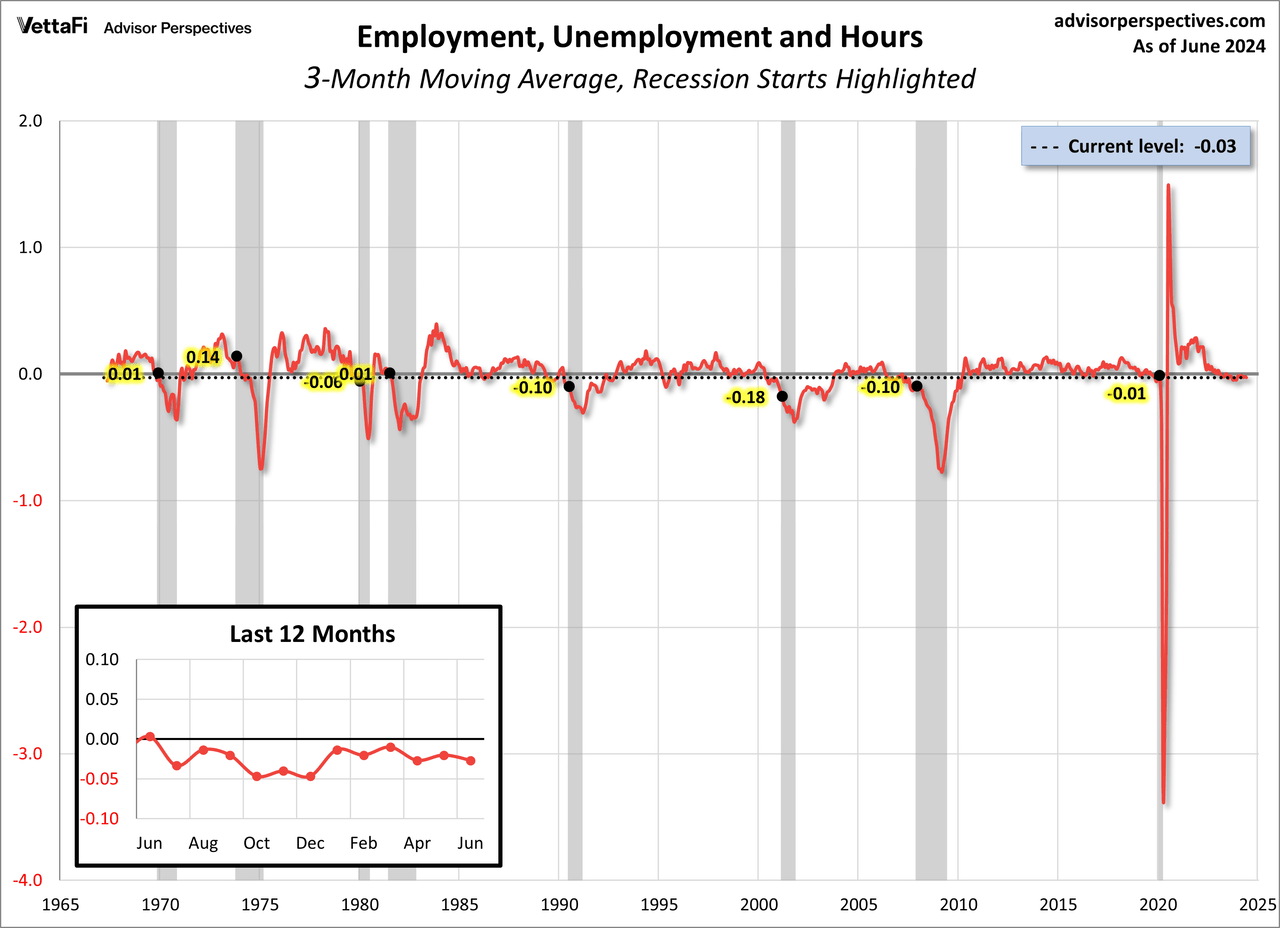
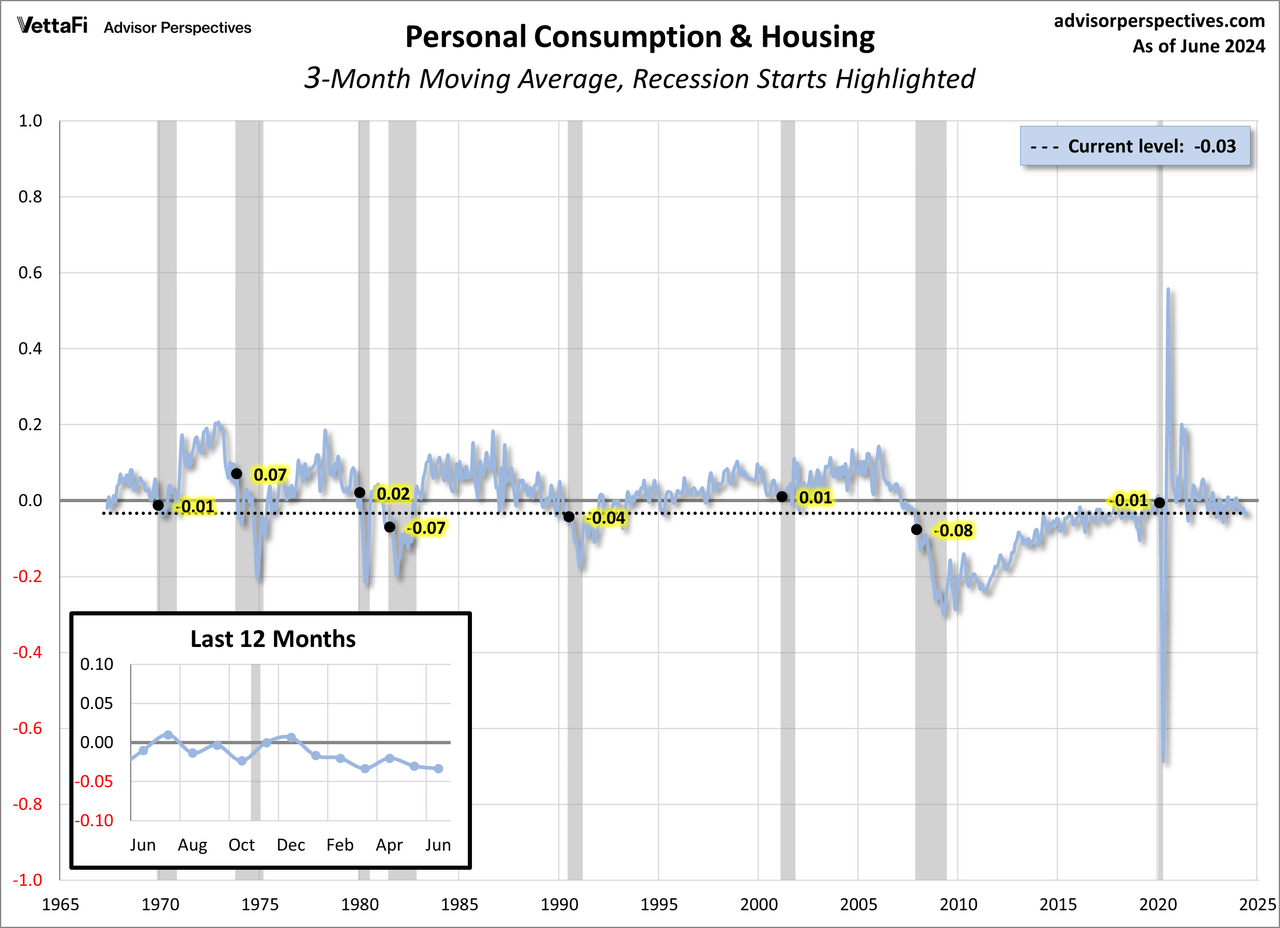
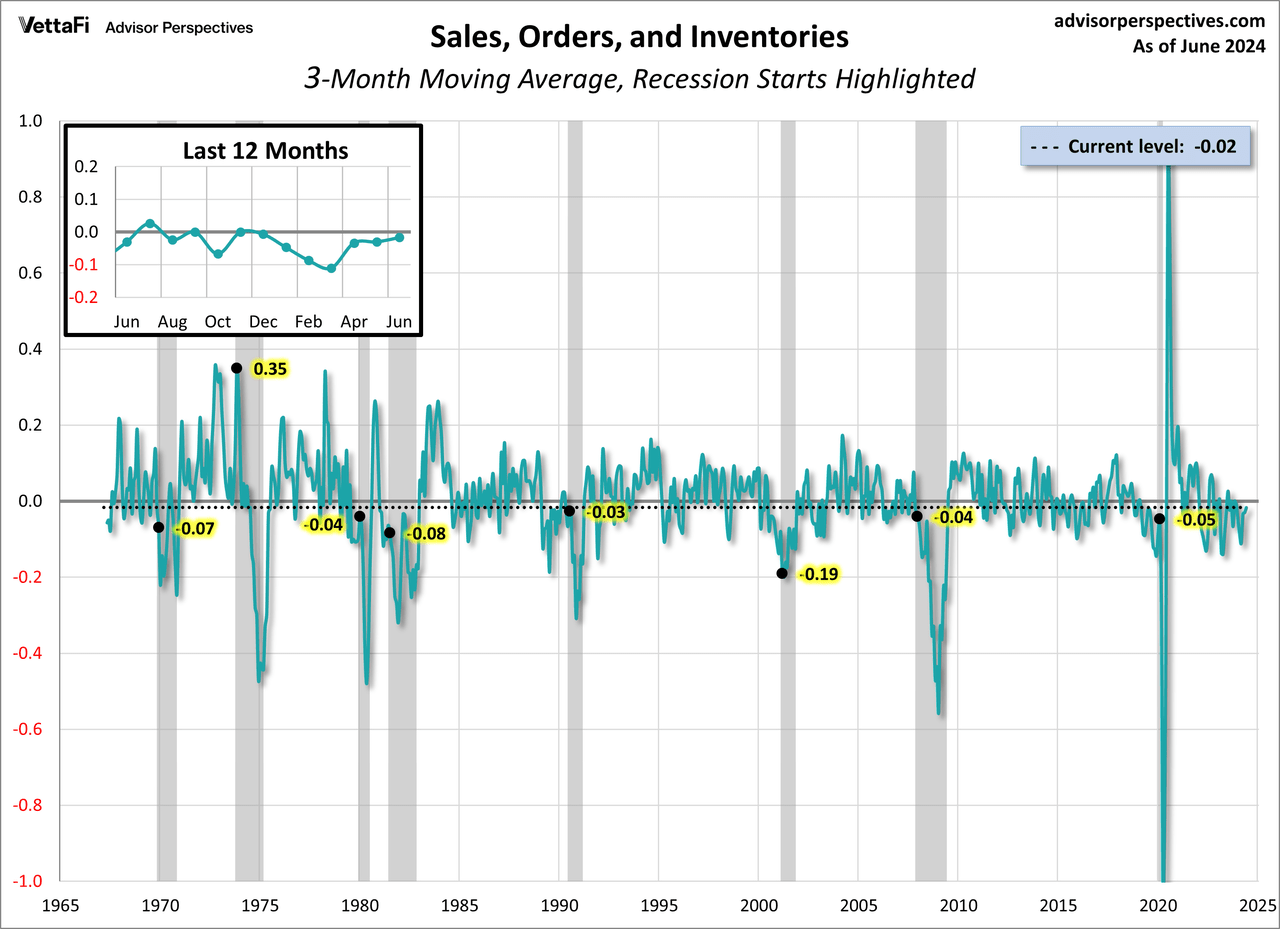
The next set of charts show each of the four components since 1967 with callouts for the last year. Because of the highly volatile nature of the data, the charts are based on three-month moving averages, a smoothing strategy favored by the Chicago Fed economists. The values for the months that the NBER subsequently identified as recession starts are also indicated.
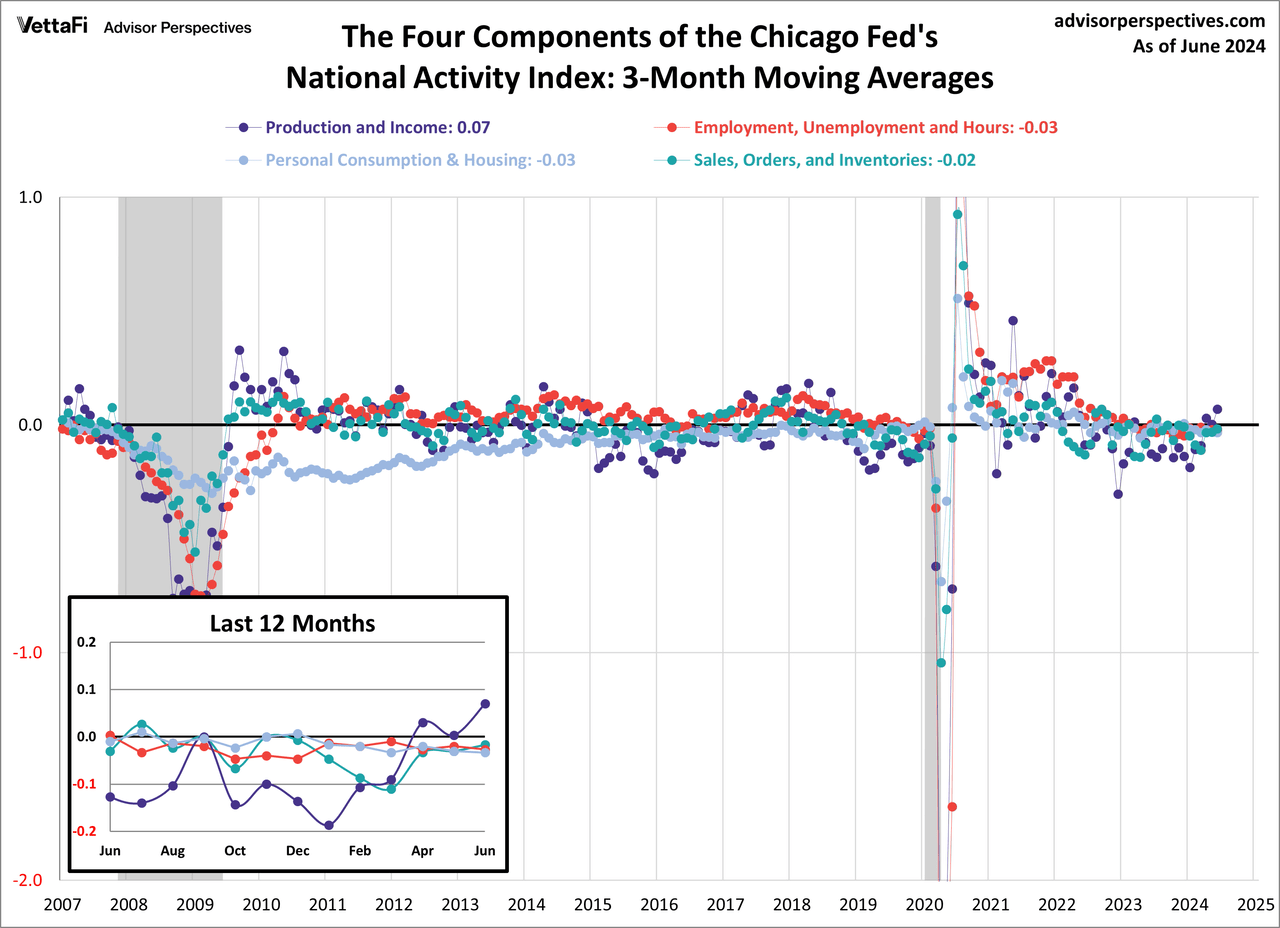
To close, let’s reassemble the index for a closer look at their collective three-month moving averages since 2007.
Original Post
Editor’s Note: The summary bullets for this article were chosen by Seeking Alpha editors.
Read the full article here
")
")
")
")

")