


")
Royal Bank Of Canada (NYSE:RY) is the largest bank of the Big Five Canadian banks. In Canada, banking is a near-perfect oligopoly where 90% of the market is divided between the Big Five. This means that competition is relatively limited, and so is a first check mark for us, prospective investors. Additionally, the Canadian banks are generally very well capitalized and run conservatively – RBC has been continuously paying dividends since 1870. Let’s first take a rather high-level look at the returns offered by Royal Bank of Canada.
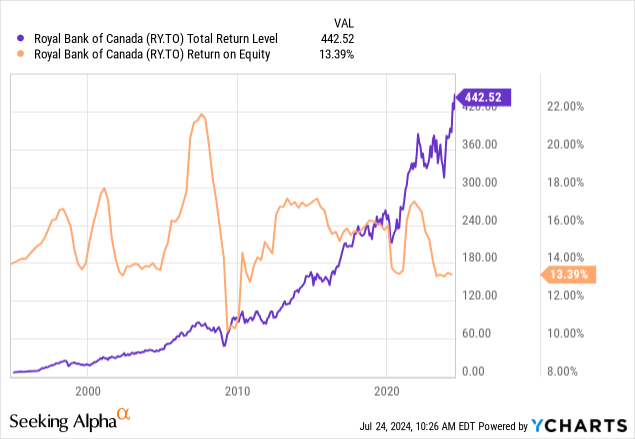
Back in 1995 when the graph started, the share price was ~$6/share. If RBC had been held for the 30 or so years since then, the stock would have a total return level of $442.52, or a ~15.4% annualized return. That’s quite eye-popping, isn’t it, for what appears at first to be a stodgy bank stock? However, it also coincides roughly equal the average return on equity of RBC over the past 30 years, where if we eyeball the graph we also get about 15%. This is no random coincidence, but rather reflects the market as a weighing machine in the long run for stock prices.
Ok, you might say, that is all well and good for RBC, but that is past performance, and there is no guarantee that the future performance is going to be like the past. Things might change in the future. The rest of this article is going to try to convince you otherwise – that RBC is good for a very long-term buy & hold, dividend reinvestment strategy.
What appeals to me about banks in general is that their business model is simply timeless. Nearly nothing could disrupt the business model of a bank – as technology advances, it might change the manner in which a bank does business, but it has not changed the way that banks make money.
I can sum up the basic banking business model in two sentences:
A bank lends money at higher interest rates than it borrows money and earns the difference, as well as charges fees associated with the accounts. Large banks also manage assets, and charge fees for that, both fixed and as a proportion of assets under management.
These two simple sentences are enough to motivate my procedure for how we will examine the Royal Bank of Canada’s track record. I like to zoom way out and look at a multi-decade track record from 30,000 feet, to see the big picture.
Banking Is Timeless
As the economy grows, the sheer quantity of deposits and loans generally has to grow with it. Incomes and personal balance sheets grow over time, and those have to be placed somewhere – where else but a bank? As the economy grows, so does the demand for loans. RBC accepts deposits from its customers for safekeeping, and in turn, lends them out at a higher interest rate than they pay on the deposits. Just as the Canadian economy grows over time, so do the Royal Bank of Canada’s loans and deposits:
Past RBC Annual Reports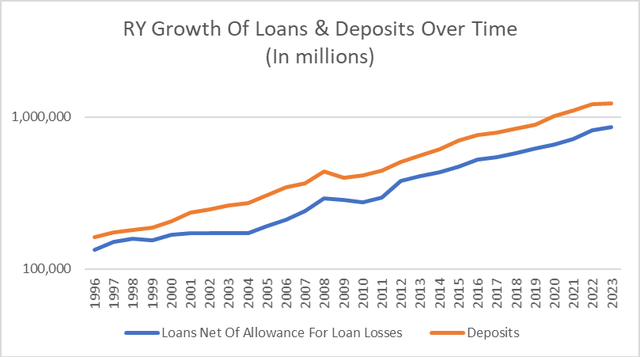
Those are nearly perfect straight lines on a log scale, and so that translates into nearly perfect exponential trends over time. Loans grew by about 7.10% per year over this time, and deposits grew by about 7.81% per year during the 27 years that this graph shows. The plain fact, in my opinion, is that Royal Bank of Canada’s business is perfectly scalable for any size. Note that there is plenty of history that isn’t shown that reaches all the way back to 1870. The beautiful thing is that, unlike other businesses, there is really no limit as to how big the Royal Bank of Canada can grow over time in my view. RY is simply the ultimate scalable business.
Net Interest Margin is calculated by subtracting interest expenses from interest income and dividing the result by earning assets, which are assets that generate interest, such as loans, leases, and investment securities. It’s basically a measure of the profitability of the bank’s assets adjusted for leverage costs. Below is a chart of Royal Bank of Canada’s net interest margin for the past 27 years:
Past RY Annual Reports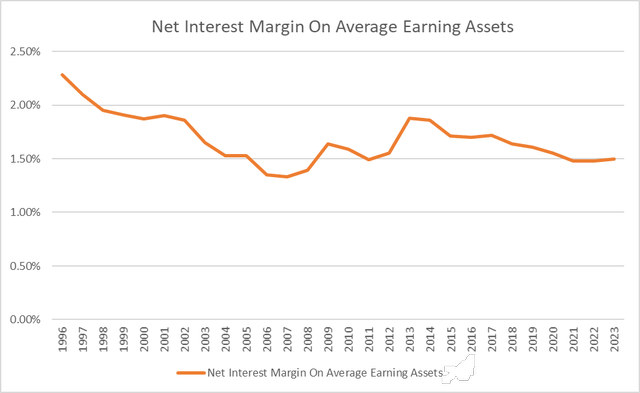
While earnings calls and many other analyses of RBC like to focus on the year-by-year gyrations of net interest margin, I think it’s better to zoom way out when looking at this metric. It’s true that it fluctuates year to year, but when looking at it in the very long run, the fluctuations seem to become less important when we observe that the net interest margin tends to move around a historical average of about 1.7%. Again, this is an illustration of the timelessness of Royal Bank of Canada’s business model.
There are many metrics of underwriting quality, but the one I will use is “provision for credit loss”. I will graph the past 27 years’ worth of PCL as reported by RBC in its annual reports, so we see it from a zoomed-out perspective.
Past RBC Annual Reports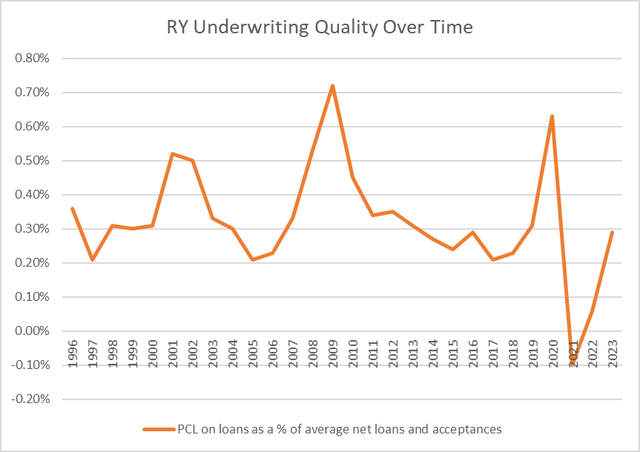
During normal business periods, PCL is consistently about 0.20 – 0.40% of loans and acceptances. PCL spikes during crisis periods to 0.50 – 0.70%, of which this graph shows three: the bursting of the dot-com bubble, the housing & financial crisis, and the COVID emergency. Consistency is the name of the game here, and this is a checkmark for a long-term buy and hold idea.
RBC is also an asset manager, earning fees on assets under management. Like loans and deposits, RBC’s AUM also grows alongside the economy, averaging out to an 11.3% CAGR.
Past RBC Annual Reports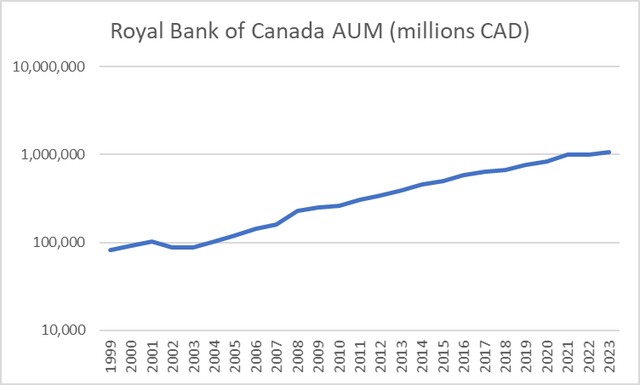
Net income from the wealth management segment has mushroomed at about the same pace:
Past RBC Annual Reports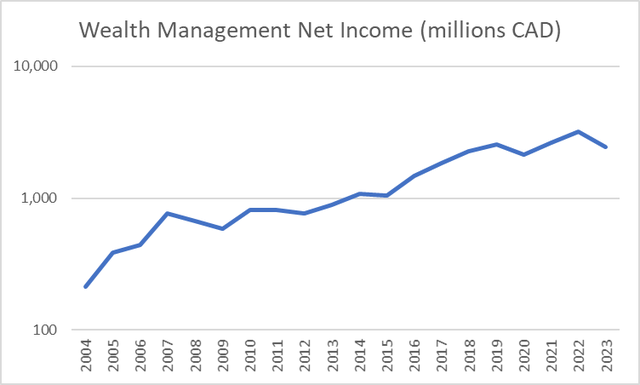
Again, just like traditional banking, wealth management too is an ultimate scalable business. By now I hope I’ve convinced you that Royal Bank of Canada, despite its enormous size, is capable of growing almost exponentially like a mushroom over time because its business model is so timeless.
RBC Exposure To Canadian Credit
For the rest of this article, I want to focus on RBC’s credit quality and its drivers. As a leading Canadian bank, RBC has a large exposure to Canadian credit. Below is a breakdown of RBC’s loan mix as of Q2 2024:
RBC Q2 2024 Conference Call Presentation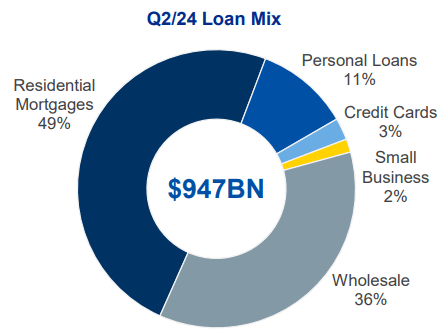
It is true that Canadians are among the most heavily indebted in the developed world – Canada has the highest household debt to disposable income ratio in the G7, standing at 185%, as compared with 125% on average for the G7. Much of this is tied to housing, which is about 55% of household wealth and 75% of household debt. As interest rates rose in 2022-2023, there was more and more financial stress among Canadians.
Temporary Financial Stress, Not Crisis
It is important to distinguish between opinion polls and actual statistics. In general, I think financial opinion polls tend to paint a more dire picture than raw statistics. In this article published in February 2023, polls seemingly produced some alarming messages.
For instance, 1 in 6 polled said that they would likely default on a major loan or mortgage in the next 60 days. I seriously doubt that this actually transpired, if it did this supposed rash of defaults would have certainly made the news. So would the poll opinion that states that 12% of Canadians are likely to declare bankruptcy – a true tidal wave. 26% said that they would be unable to cover an unexpected expense of $500 – something like this was already true of the US, a less indebted nation, in 2019 before COVID. These are all messages of stress, not crisis.
Here are some actual statistics: In 2022, Canadian business insolvency filings grew 37.2%, while consumer insolvencies grew 11.2% in 2022. However, it is important to know the base on which these alarming-looking percentages are built. The same article stated that in 2022, 3,400 Canadian businesses filed for bankruptcy, out of a total of 1.22 million employer businesses in Canada in total. Additionally, just 0.29% of adult Canadians filed for insolvency in 2021. Ultimately, the claims in this aforementioned article amount to little more than upticks. Again, a sign of stress, not a sign of crisis.
This stress should not stay for long – I believe that it is very much a transient phenomenon. Both the US and Canada passed stimulus measures to combat the COVID recession, and both countries had to hike rates to deal with the inflation. We are soon seeing the end of that inflation. Indeed, the Bank of Canada has already cut rates twice: once on June 5, 2024 from 5.00% to 4.75%, and then on July 24, 2024 from 4.75% to 4.50%. Canadian inflation fell to 2.7% in April 2024, which is very close to a 2% target for normal inflation. I believe more rate cuts should follow soon as GDP growth expectations for 2024 fell from 1.5% to 1.2%, reflecting a weakening economy.
In my view what Canadians experienced was a short sharp shock, not chronic pain. To see how these recent events impacted RBC, let’s peek at RBC’s asset book. I will pull up some helpful graphics from the Q2 2024 conference call presentation.
Q2 2024 RBC Conference Call Presentation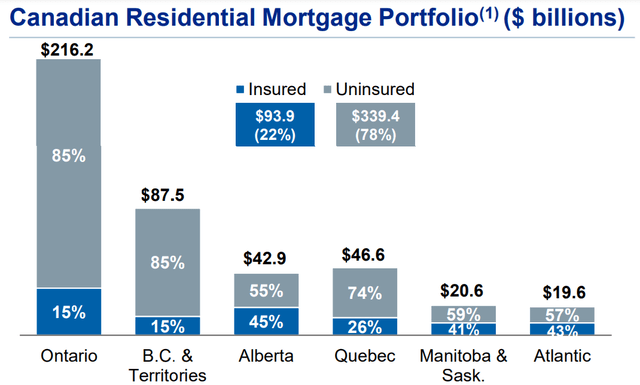
78% of mortgages are uninsured, meaning that they started off with at least a 20% down payment. Only 22% of mortgages began with a down payment of less than 20%. The bulk of the value of mortgages on RBC’s books are in the provinces of Ontario and British Columbia, the two provinces with the highest home values in Canada. Some further statistics on the real estate mortgages themselves:
Q2 2024 RBC Conference Call Presentation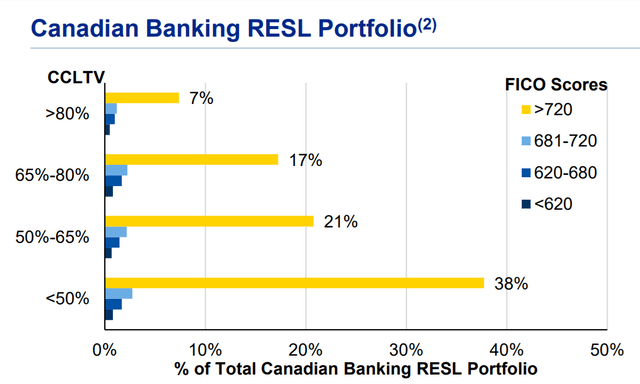
Aggregating across the loan-to-value ratio categories, a vast majority – 83% – of mortgages are associated with FICO scores above 720, which is considered “good” to “excellent”. Only a marginal fraction of mortgages are associated with a FICO score under 620, which is near the minimum allowable credit score for a mortgage in Canada. By this metric of quality of personal finances, most of RBC’s mortgages are actually doing just fine. Additionally, around 40% of mortgages have a loan-to-value ratio of under 50%, and just over 7% have an LTV ratio of greater than 80%. The vast majority of mortgages are “prime”.
Q2 2024 RBC Conference Call Presentation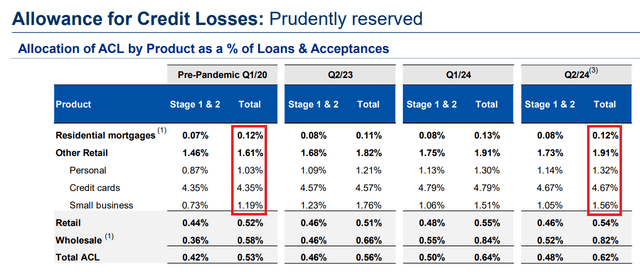
If we look at the allowance for credit losses, we can see that the figures for Q2 2024 are roughly equal to those of the pre-pandemic period in Q1 2020. ACLs for residential mortgages are the same in both quarters, indicating that Canadians are still paying their mortgages on time. There is a slight increase in ACL for personal, credit cards, and small businesses, which to reiterate, is a slight uptick, and not a crisis.
The norm in the Canadian mortgage market is for mortgages to reset their rates on a 5-year cycle. This means that if a mortgagee is lucky enough to lock in a low rate, it’s only guaranteed to remain low for 5 years. It also means that mortgage rates are reset cohort by cohort. A further uptick in ACL is likely to happen in 2025 – 2026 because of the 2020/2021 cohort of mortgages resetting their rates higher, but again, nothing like an all-out crisis in my opinion.
Drivers Of The Canadian Housing Market
Canada is a country built on immigrants, and its recent history is no exception. The population grew past 40 million for the first time in 2023, where during that year the population grew by 3.2%, the fastest rate since 1957. This is a rate unheard of in developed countries. 97.6% of that growth was immigration and just 2.4% of it was natural growth.
Canada is on track to welcome 500,000 new permanent residents in 2025, which is twice as many as in 2015. Part of what drives migration of temporary residents is the knowledge that the way to get a permanent residency in Canada is to start as a temporary resident, which makes people “try their luck”.
This sort of explosive population growth drives housing demand. In recent years, population growth has exceeded the growth in available housing units. This drives housing prices and rents upwards, which has become a political liability for the Liberal government. There is an overwhelming majority opinion in Canada that immigration is causing the housing crisis and also putting pressure on the healthcare system.
The shortfall in housing supply is quite massive. About 5.8 million new units of housing need to be built in Canada by 2030 to fix the housing supply, according to the Canada Mortgage and Housing Corporation. Canada is on track to actually construct 2.3 million units, leaving a shortfall of 3.5 million units. The gap between population growth and housing construction is the widest it has been in 50 years.
An immediate consequence is a low vacancy rate and rising rents. The vacancy rate for purpose-built rental apartments was 1.5% in 2023, which is the lowest figure on record since records began in 1988. The average rent for a 2-bedroom apartment rose by 5.6% in 2022 and 8% in 2023, higher than the 1990 – 2022 average rate of 2.8%. Home prices are also supported by population pressure.
Rise In Home Prices & Mortgage Markets
Canada’s high home prices have been a long time a-brewing. One of the biggest contributors is the difference in how the US and Canadian housing markets were hit by the subprime mortgage crisis. Simply put, Canadian real estate never suffered the sell-off that afflicted US real estate. That and elevated housing demand due to population growth is enough to keep home prices high and rising.
FRED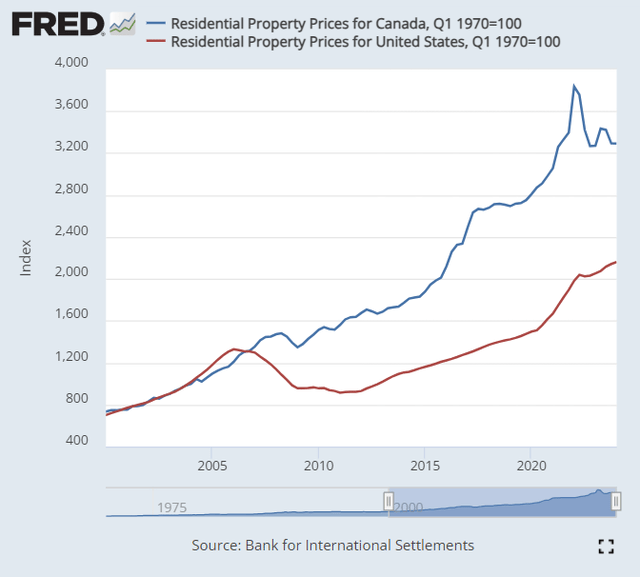
The was a brief respite in home prices in 2022 – 2023 caused by rising interest rates. Higher rates mean higher mortgage payments, which put some downward pressure on Canadian home prices. The Toronto market was hit hard, with prices temporarily falling about 19%. Yet now home prices are again starting to rise, despite a slump in sales. More salient to credit quality at banks though is how well Canadian mortgagees can continue to afford to pay their mortgages.
A study by researchers at the Bank of Canada found the following:
- By the end of November 2023, about 45% of the mortgages taken out before the Bank of Canada started raising its policy interest rate in March 2022 had seen an increase in payments.
- By the end of 2026, virtually all remaining mortgage holders in this group will go through a renewal cycle and, depending on the path for interest rates may face significantly higher payments.
- Borrowers who either took out a mortgage in 2021 when interest rates were at historical lows or opted for a variable mortgage rate will generally have experienced the largest increases in payments by the end of 2026.
- Among variable-rate mortgage holders, those with fixed payments who have not taken action to avoid large future increases will be impacted at renewal. For this group, median payments are expected to increase by 54% during the period between the end of February 2022, just before interest rates began to increase, and the end of 2027.
- In contrast, those with variable payments have already been impacted, with median payments up 70% in November 2023 compared with their level at the end of February 2022. However, based on market rate expectations, payments are expected to decline for this group starting in mid-2024.
The immediate question here that arises for someone with US life experience is: will strategic defaults start happening? I believe that it is at this point unlikely, and this is because of how mortgages work in Canada. In Canada, mortgages with less than 20% down payment have to be insured, and mortgages with at least 20% down payment may be uninsured. However, most mortgages in Canada are recourse mortgages, except for those in the provinces of Alberta and Saskatchewan (about 4.8 million and 1.2 million respectively, out of ~40 million total in Canada), where uninsured mortgages can be nonrecourse.
Strategic defaults were a problem in the 1980s because high interest rates in the 20% range caused simultaneously job losses, home prices to fall, and mortgage payments to rise. Relative to today that was an extreme case, however, and borrowers today are nowhere near exposed to that kind of Paul Volcker-era interest rate gyration. Additionally, because only uninsured mortgages (with at least 20% down payment) are allowed to be nonrecourse in Alberta and Saskatchewan, it would take a very large house price downturn to eliminate the homeowner’s equity position in the house.
Because of the above and how population growth supports home prices in Canada, I believe that “jingle mail” is highly unlikely to become a problem in the short run – hence it is highly unlikely there will be a tidal wave of properties with fresh defaulted mortgages entering the market and depressing home prices, which was the experience of the US in the subprime crisis, particularly in California. The contrast is with the US subprime crisis, where part of the problem was negative equity, which was much easier to achieve because down payments could be very small.
Mortgage Standards In Canada
I want to dwell a bit more on the rules that exist in the Canadian mortgage market. These represent further protections on Canadian banks’ credit quality that weren’t present in the US during the time that led up to the subprime crisis.
- Minimum down payment: The current rule is that if a home has a purchase price under $1 million, 5% of the first $500,000 of the purchase price and 10% of the portion above $500,000 must be the minimum down payment. Homes worth $1,000,000 or more must have a 20% minimum down payment.
- Maximum amortization periods: 25 years for CMHC-insured mortgages (those with under 20% down payment) and 35 years for non-CMHC insured mortgages (those with at least 20% down payment).
- Debt service ratios: The CMHC restricts the GDS (Gross Debt Service) ratio to 39% and the TDS (Total Debt Service) ratio to 44%.
- Stress tests for both insured and uninsured mortgages: uninsured mortgages are (currently) subject to a contract rate + 2% or 5.25%, whichever one is greater.
- Minimum credit score: As of July 5, 2021, the CMHC reduced the minimum credit score requirement from 680 to 600.
This is by no means an exhaustive list, and these rules are often updated and tweaked. However, the existence of these rules is enough to be able to say that mortgages in Canada are generally “properly” made in the current environment where they are backed by the fundamentals of the borrower, a far cry from the wild west of the US subprime market in the 2000s. Mortgages in Canada are formally of sound quality.
Recent Developments
Next, I’ll trawl the recent news for recent developments. I’ll try to stay away from the quarterly update content and present the more interesting aspects that take a little more digging to find.
RBC Splits Bank Operating Unit
RBC has recently decided to split its personal & commercial banking segment into two separate segments, personal and commercial, in the hopes that the two separated segments will be more nimble under separate leadership. I will quote this article:
These changes, effective September 1, 2024, better position RBC to take advantage of its scale, speed up decision-making, and elevate leaders to deliver on strategic growth priorities with clients at the centre…
As RBC has over 15 million clients, including a growing base of commercial clients, the new structure is designed to better respond to evolving client needs and further differentiate the bank in the market. With this change, RBC Direct Investing will move to the Wealth Management segment.
The reshuffling of leadership seems to be about making the leaders’ skills and talents more closely align with the actual business segments they are leading. Right now I think it’s too soon to make any predictions about how things will pan out, though I would share the hope that RBC will see increased growth across the board under the new leadership structures.
Q2 2024 Conference Call
… the acquisition of HSBC Canada, which we completed on March 28th [2024]. This was a pivotal milestone as we continued to focus on driving premium long-term ROE and growth. We’re excited to welcome 780,000 clients from HSBC Canada, which added approximately $75 billion of both loans and relation-based deposits to our balance sheet.
… we are executing on our growth strategy across our largest franchises, starting with Canadian Banking. Deposits were up double-digits from last year, or a strong 9% excluding the benefit of the HSBC Canada acquisition. We welcomed a record number of newcomer clients this quarter, reflecting a 30% increase year-over-year.
RY is doubling down on expanding its Canadian footprint and maintaining its lead there. Canadian banking is an oligopoly, where competition is limited. As a result, returns on equity in Canadian banking are high compared to that of the US. It is good to see RY maintaining its lead in Canada.
HSBC Canada was the 7th largest bank in Canada before its acquisition. As of its 2023 annual report, it had total assets of $119.7 billion CAD, loans and credit of $74.1 billion CAD, common equity of $5.9 billion, and it earned a 14.1% return on equity.
Investment banking revenue grew 45% from last year. Our market share is up 40 basis points over the last 12 months, reflecting gains across all major products… While geopolitical risks and an evolving regulatory environment creates uncertainty, the market backdrop is creating opportunities for increased dialogue with clients and a healthy M&A pipeline that continues to build.
… Assets under administration and our leading Canadian wealth management business were up 15% or nearly 80 billion from last year, increasing to a record level of nearly $620 billion, benefiting from higher equity markets and net sales of $16 billion over the last 12 months. Assets under administration at our U.S. wealth management platform, including the sixth largest wealth advisor in the U.S. also increased 12% year-over-year to $610 billion, another record.
Not much of a surprise because of the recent stock market performance over the past year. The S&P 500 is up around 19% TTM.
Q1 2024 Conference Call
City National has grown considerably since we acquired the bank in early 2016. One of our top priorities over the last couple of years has been to execute against extensive and detailed action plans, including investing in the appropriate risk and control infrastructure, as well as new leadership. Looking forward, our focus at City National is to deliver a more normalized level of net income in 2025, including costs associated with an enhanced operational infrastructure.
Q1 2024 Earnings Presentation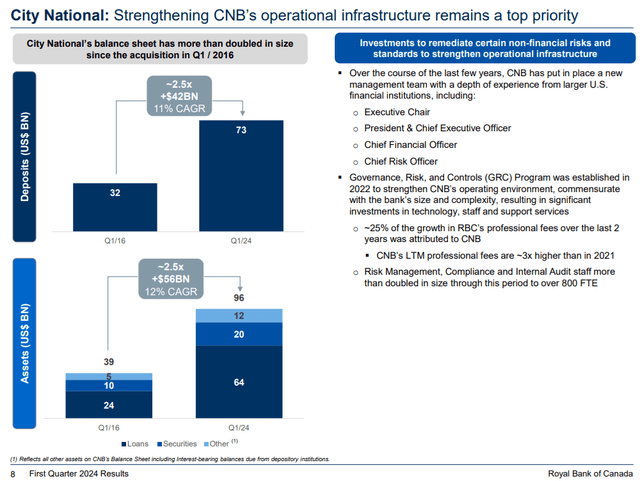
RBC has a history of growth by acquisition – it is nice to note that this strategy is working. As of Dec 31, 2023, City National is the 30th largest bank in the USA. It was acquired by RBC for $13.5 billion in a cash and stock deal. City National offers both banking, trust, and investment services, and has 75 offices and 19 full-service regional centers.
This is an article I’d recommend if you’re curious about digging deeper into RBC’s history. The “Recent History” portion nicely details the major transactions RBC has participated in.
Q4 2023 Conference Call
As we detailed on Slide 34, over half of our Canadian Banking residential mortgage balances renew in 2025 or 2026. The fixed rate borrowers in those cohorts currently pay an average rate of 3.1% and 3.5%, respectively. As more people renew at higher rates and more of their income is used to service mortgage debt, we expect delinquencies and losses to increase in the retail portfolio. Our mortgage exposure benefits from the strong credit quality of our clients, significant borrower equity, and our clients’ capacity to make higher payments.
The typical Canadian mortgage does not have a fixed rate for 30 years, but rather resets the rate every 5 years based on market conditions. The cohort of mortgages up for renewal in 2025 and 2026 last had their rates set in 2020 and 2021, which explains the average rates of 3.1% and 3.5%. When those mortgages reset to higher rates, the mortgages will produce more interest income, but at the same time, the portfolio should see more credit losses. To what extent do these two effects cancel each other out, or if one predominates over the other, is unfortunately not hinted at during the call, and so that will remain a question mark on short-term earnings.
Advisor recruiting remains a key source of growth. Our leading Canadian Wealth Management business hired 40% more competitive recruits than last year, resulting in a record year for recruited assets. Our U.S. Wealth Management platform, the sixth largest wealth advisor in the U.S. play [by] assets under administration recruited 94 advisors this year, driving over CAD $20 billion of expected AUA growth. Our U.S. Wealth Advisory business has become the destination of choice for top talent in the industry because of our strong culture, entrepreneurial environment, innovation, and competitive products.
This goes to show that the exponential growth of assets under management doesn’t entirely happen all by itself – there is competition between firms to recruit wealth management advisors, and RBC is winning it.
Market Valuation
Let’s look at RBC’s price history first:
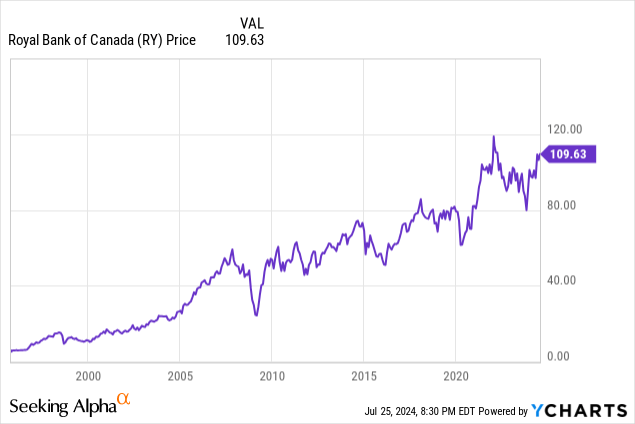
Clearly, RBC is currently trading near its all-time high that it reached around 2022, and so at first glance, it might seem that RBC shares are very expensive right now. Peeking at RBC’s P/E and P/B ratio history reveals something more interesting:
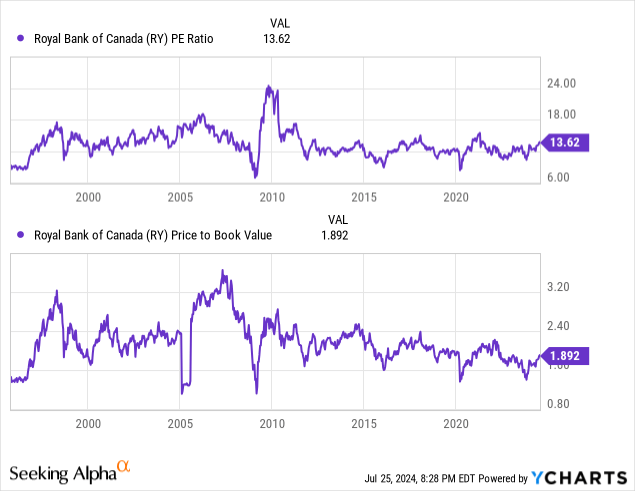
The market seems to value RBC quite consistently in terms of P/E and P/B ratios. RBC’s P/E ratio has largely hovered around 13 – 14, becoming distorted only around 1999, 2007, and 2010. Its P/B ratio too hovers around 2.00. Both ratios have been roughly rangebound for the past decade. This is consistent with the valuation for a mature company where the market says “show me the numbers”. Even though RBC trades near its all-time highs, its valuation ratios suggest that the fundamental valuation has not actually changed. Given this, I think the best way to start a position in RBC is by buying in small chucks over a period of time.
Next let’s compare RBC’s valuation with those of its four peers, The Bank of Nova Scotia (BNS), The Toronto-Dominion Bank (TD), the Canadian Imperial Bank of Commerce (CM), and the Bank of Montreal (BMO).
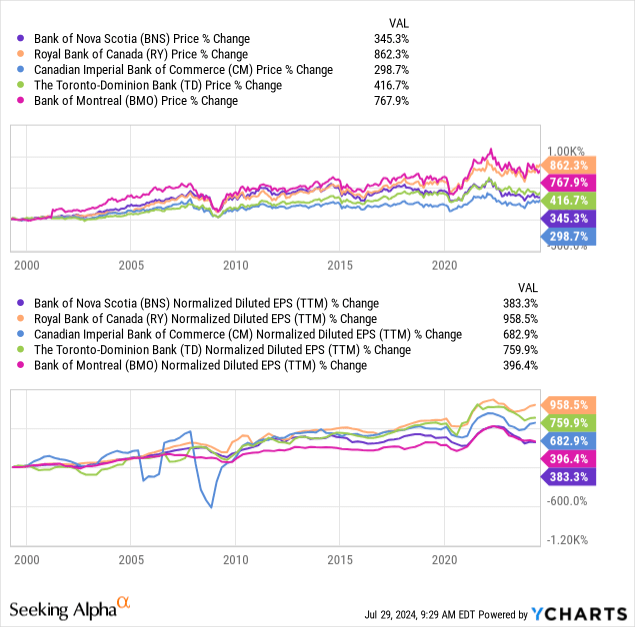
Percentage-wise, RBC has grown its earnings the most, as well as grown its share price the most since 1999. However, there doesn’t seem to be an order going on: for instance, TD increased its share price by 416.7% while increasing its EPS by 759%, suggesting multiple compression, while BMO increased its share price by 767.9% but increased its EPS by 396.4%, suggesting multiple expansion.
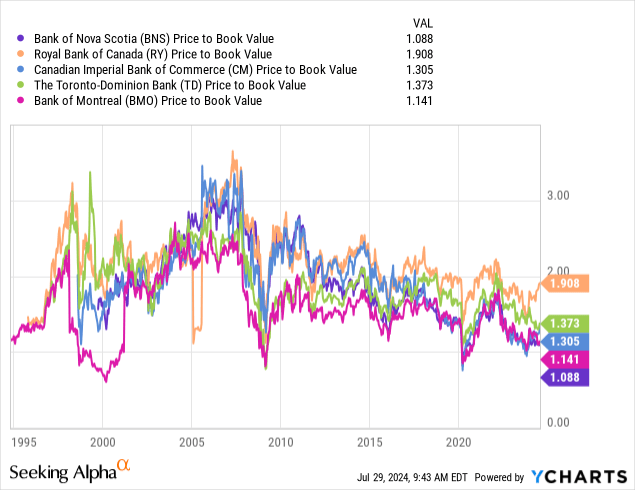
Furthermore, for all 5 big banks in Canada, their P/B ratios have come down since 2007, however unevenly. Currently, RBC trades as the most expensive bank in Canada as measured by P/B ratio. The pure bargain hunter-minded investor might find better raw bargains in the other Canadian big banks. Next, let’s compare the dividend yields:
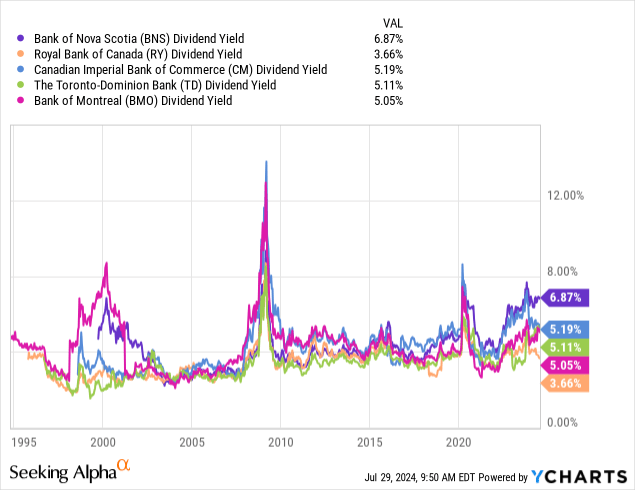
Of the Big 5 Canadian banks, RBC has the lowest dividend yield, at 3.66%. The other big banks have dividend yields in the 5 – 6% range. This reflects the expectation that more of RBC’s returns should be in the form of capital appreciation. Investors who are more oriented toward capital gains might consider RBC to be the better bet.
Risks To My Thesis
My main thesis so far has been that while it is true that RBC faces headwinds to its Canadian credit quality due to mortgages resetting at higher interest rates, where it will likely only experience small upticks in credit losses, how about the scenario that the Canadian economy becomes much worse than the US economy? Currently, US unemployment is at 4.1% as of June 2024, while Canadian unemployment is at 6.4%.
It seems unlikely that Canadian unemployment will go much higher than what it is now. I will quote a study conducted with a panel of 12 Canadian economists from different private sector organizations:
As the economy slows, the unemployment rate is expected to rise to 6.5 percent in the fourth quarter of 2024, remaining historically low and far below the peaks experienced during recessions. Amid ongoing solid population growth, this adjustment is expected to largely reflect a slower pace of hiring, rather than a large rise in layoffs. The unemployment rate is anticipated to settle at an average of 6.3 percent in 2025 and continue to gradually decline to 5.7 percent by 2028, similar to the FES 2023 projection.
Additionally, the pressure on household budgets coming from inflation and interest rates are expected to continue to ease:
Private sector economists expect Consumer Price Index (CPI) inflation to continue to ease and reach about 2 percent, within the Bank of Canada’s target range, at the end of this year. On an annual basis, CPI inflation is expected to decline from 3.9 percent in 2023 to 2.5 percent in 2024 and to normalize to around 2 percent over the remainder of the forecast horizon, the same as in FES 2023.
Short-term interest rates are expected to decline from an average of 4.8 percent in 2023 to 4.5 percent in 2024 and to 3.1 percent in 2025, about 20 basis points higher in each year compared to FES 2023, before settling at 2.7 percent over the last three years of the forecast horizon. Long-term interest rates are expected to average 3.3 percent over the forecast horizon, an upward revision of about 10 basis points on average per year compared to the FES 2023 projection.
Another possible risk to my thesis is that RBC’s market valuation could go through multiple compression. This is a valid concern, as multiple compression is a possible outcome as shown by my comparison of the Big 5 banks in my valuation section. The current P/E ratio of RBC is about 13.6, where RBC tends to trade somewhere between 11 – 15x earnings historically. There seems to be a little room for multiple compression right now.
Read the full article here


