
 (NASDAQ:MU)")
")


Monthly estimates of Personal Consumption Expenditures (“PCE”) contained in the report on Personal Income and Outlays, published by the Bureau of Economic Analysis (BEA), constitute some of the most important high-frequency indicators of economic activity in the U.S. The value of Personal Consumption Expenditures represents over 60% of U.S. GDP. The most recent PCE data, corresponding to the month of December 2023, was published by the BEA at 8:30 AM, January 26, 2024. In this article, we will walk our readers through an in-depth analysis of the most recently published PCE data, and then discuss their implications for the U.S. economy and financial asset prices.
Summary Data and Analysis
We begin our examination of the BEAs report on PCE in the month of December 2023, with summary data and analysis, which we highlight in Figure 1. We recommend that readers pay particular attention to the percent rank of Month-on-Month (MoM) growth, MoM acceleration, and the surprises relative to forecasts.
Figure 1: Change, Acceleration, Expectations, and Surprise
PCE Summary Data & Analysis (BEA & Investor Acumen)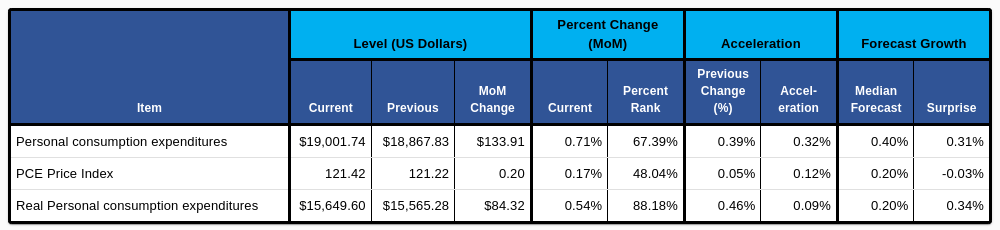
Nominal PCE accelerated significantly from the prior month (+0.32%) and beat expectations. Real PCE also accelerated but to a lesser extent (+0.09%).
The Impact of Inflation on the Purchasing Power of Personal Consumption Expenditures
In this section, we highlight the impact of inflation on PCE data. Inflation affects the purchasing power of any given dollar amount of money that is spent by consumers. In other words, inflation affects the quantity of goods and/or services that a given amount of money can buy. In Figure 2, we show PCE in both “current dollars” and in “real” terms. The “real” figures adjust the nominal current dollar figures for the changes in purchasing power caused by inflation/(deflation). The purchasing power adjustments to the PCE consumer spending data are made by applying the appropriate PCE price indexes (PCEPI), that are published on the same day as the report on Personal Income and Outlays.
Figure 2: PCE in Current Dollars and Adjusted for Inflation
PCE Inflation Adjustment (BEA & Investor Acumen)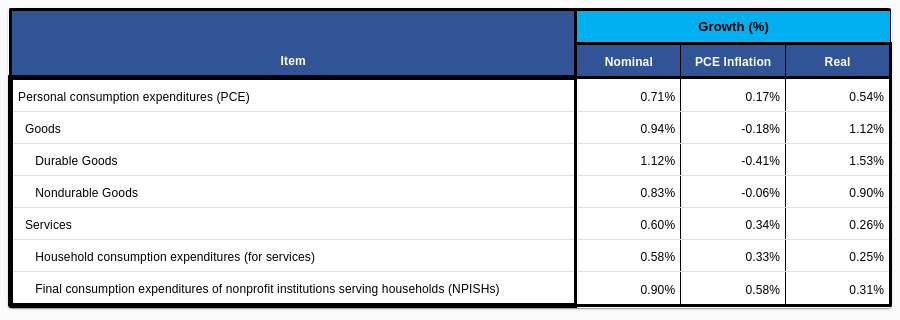
Goods, and in particular Durable Goods, experienced deflation. However, the larger Services component experienced significant inflation, though still grew strong on a real basis.
For the remainder of this article, all figures will be presented in “real” (inflation-adjusted) terms.
Analysis of Annualized Growth of Major Components of Real PCE Over Various Time Periods
In this section we break down Real Personal Consumption Expenditures, or PCE, into major components, scrutinizing their annualized growth rates over various time frames (1m, 3m, 6m, and 12m). The purpose of this analysis is two-fold. Our first purpose is to identify which components of PCE are growing at a faster or slower rate than the overall aggregates. Our second purpose is to determine whether, and to what extent, growth rates are accelerating or decelerating over various time frames.
Figure 3: Annualized Growth Rates of Major Components of Real PCE
Real PCE Annualized Growth (BEA & Investor Acumen)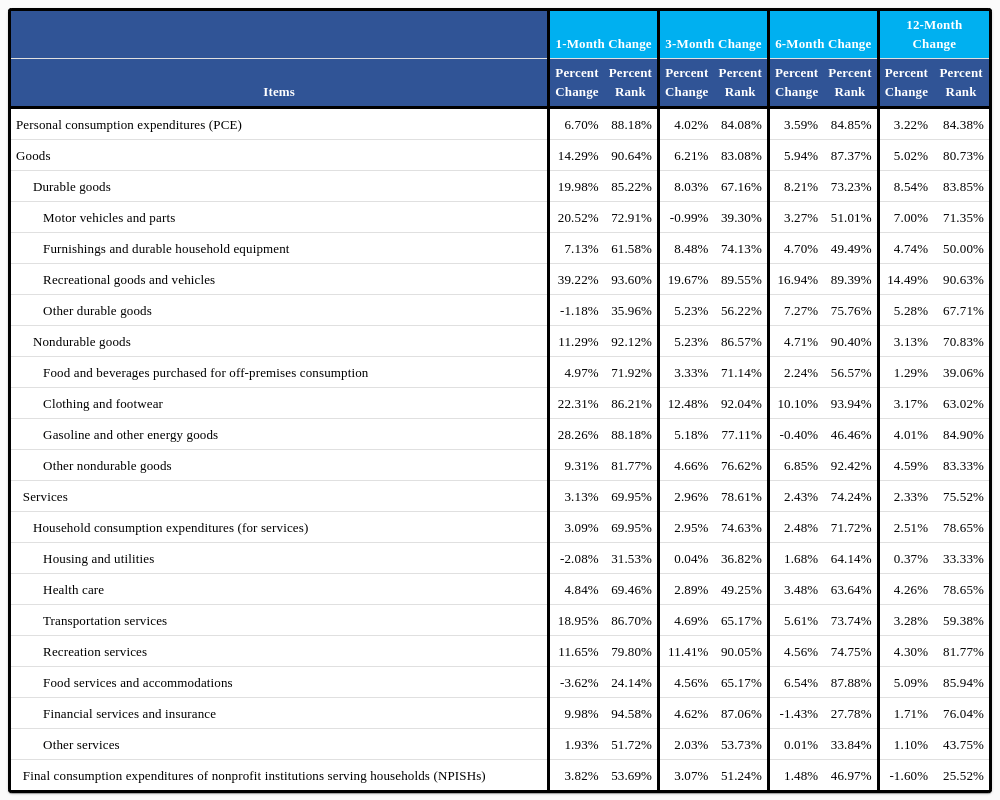
Real PCE growth has been historically high for the past 1, 3, 6, and 12-month periods (all above 80th percentile).
Contributions to Change and Acceleration of Real PCE: Components Analysis
In this section, our analysis is focused on the component contributions to the MoM Change and MoM Acceleration that are attributable to select major components of PCE.
Figure 4: Contributions to Change and Acceleration Attributable to Major Components
Real PCE Contribution to Change (BEA & Investor Acumen)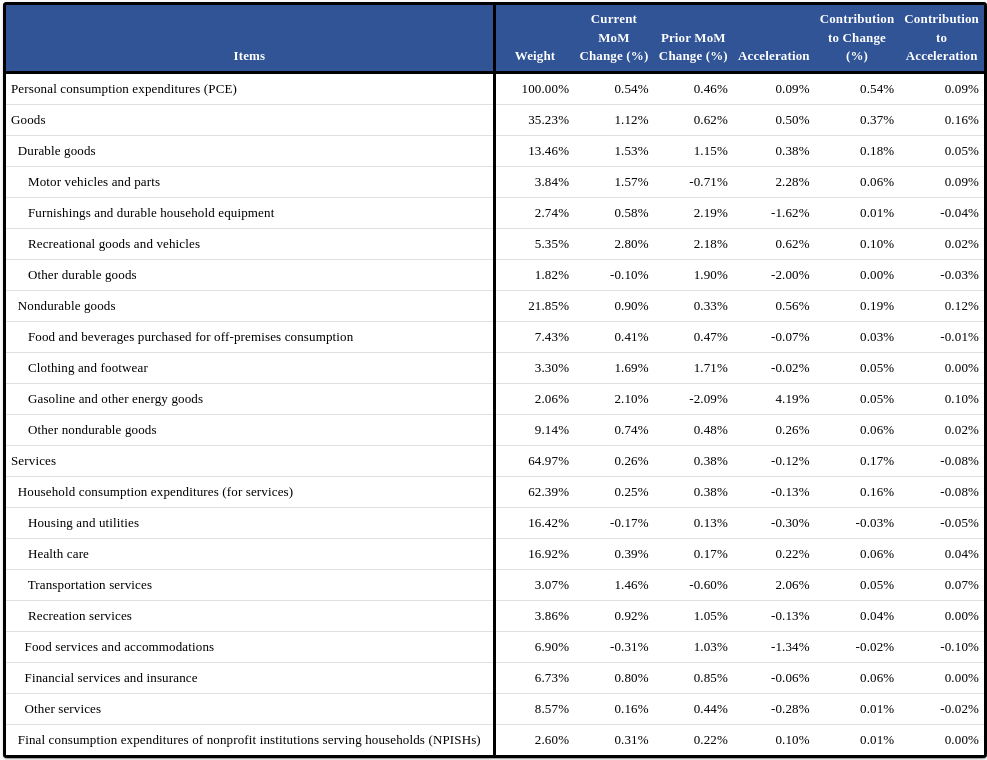
Real PCE acceleration during the month of December can be attributed to the Goods sector. Gasoline and other energy goods (+0.10%) and motor vehicle and parts (+0.09%) contributed to the vast majority of acceleration this month. Notably, Food services and accommodations (-0.10%) and Housing and utilities (-0.05%) were the largest contributors to acceleration this month.
Implications for the U.S. Economy
Personal consumption spending in the U.S. continues to grow at a very strong rate. This runs contrary to the “soft landing narrative”; it is supportive of a “no landing” narrative.
Some commentators are focused on PCE inflation measures, which have been decelerating down to the Fed’s 2% target. However, the Fed is looking at a wider set of issues. First, PCE services ex housing are a better indicator of domestic inflationary pressure, and it continues to run hot. Second, the economy is running “too hot,” as the pace of economic growth is well above historical averages, at the same time that the domestic economy is operating above its non-inflationary capacity.
With no “landing” in sight, we don’t think the Fed will be cutting interest rates any time soon. In our view, “no landing” means “no cuts.”
Implications for Financial Markets
In the short-term, the market is “having its cake and eating too,” in that it is celebrating above-trend growth at the same time that it is discounting massive interest rate cuts by the Fed. Financial markets are expecting the Fed to deliver 125 basis points in cuts to the Fed Funds rate in 2024, starting in March. This is at odds with the fact that the economy is growing at an above-average pace while the economy is running above its full non-inflationary capacity.
We think that the Fed will soon start to push back against overly optimistic expectations regarding interest rate cuts. It is our view that this will act as a headwind for markets in the intermediate term.
Concluding Thoughts
At Successful Portfolio Strategy, we see the macroeconomic environment as being generally favorable for equities. However, we think that nuance is required to account for likely disappointments of market expectations regarding Fed policy.
Read the full article here
 (NASDAQ:MU)")
")
 Q2 2024 Earnings Call Transcript")
")
")
