


: Fed’s Rate Cut Drives Capital Appreciation/Dividend Investment Story")
We previously covered Realty Income (NYSE:O) in June 2024, discussing why it remained a Buy, thanks to the promising FQ1’24 earnings results from its improved investment spread, reiterated FY2024 profit guidance, and consistently raised dividend payouts.
Combined with the stock’s inherent undervaluation compared to its historical means, we believed that opportunistic investors might continue to add this dividend aristocrat for rich yields, while waiting for a potential upward rerating in its valuations and consequently, upside gains upon a normalized macroeconomic environment.
Since then, O has offered an exemplary total return of +18% (including dividends), well outperforming the wider market at +6.2%. Even so, we are reiterating our Buy rating here, since the Fed is likely to cut rates sooner than later, with the lower borrowing costs likely triggering the REIT’s improved investment spreads.
This is on top of the REIT’s increasingly rich dividend investment thesis as the US Treasury Yields also moderate, offering dividend oriented investors with the stable monthly incomes.
O’s Well-Diversified REIT Strategy Continues To Pay Off Handsomely
O YTD Stock Price
TradingView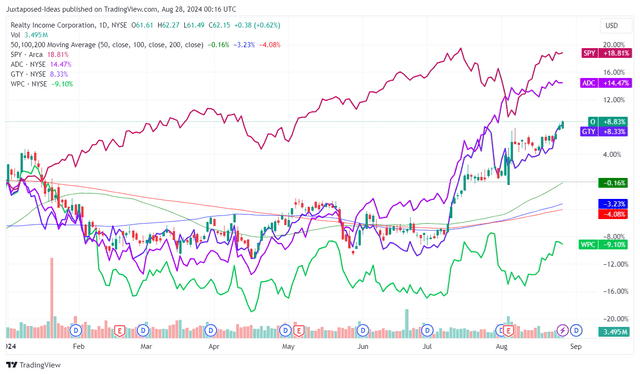
Despite the H1’24 underperformance, O has had a robust Q3’24 performance indeed, as similarly observed in its diversified REIT peers, including Agree Realty (ADC) and Getty Realty (GTY), and to a smaller extent, W. P. Carey (WPC).
Much of their tailwinds are attributed to the projected Fed pivot by 25 basis points in the upcoming September 2024 FOMC meeting, which has resulted in the moderating US Treasury Yields of between 3.65% and 5.09%.
The attractiveness of O’s dividend investment thesis is made even more attractive by the relatively rich forward dividend yield of 5.11% compared to its 4Y average of 4.74% and the sector median of 4.18%, thanks to its discounted stock valuations and the 3Y Dividend Per Share Growth at +4.33%.
We believe that the REIT remains well positioned to generate robust performance metrics, as observed in the double beat FQ2’24 earnings call with rental revenues of $1.28B (+6.6% QoQ/ +29.2% YoY including acquisitions) and AFFO per share of $1.06 (+2.9% QoQ/ +6% YoY).
The two other important metric that investors must note is O’s debt leverage and outstanding share count, given that REITs typical raise capital through a balance of debt and dilutive share sales.
By FQ2’24, O reported a moderating Net Debt to Annualized Pro Forma Adjusted EBITDAre of 5.3x, down from the 5.5x reported in FQ1’24, 5.3x in FQ2’23, and 5.9x in FQ4’19.
The REIT’s growing profitability per share is also impressive, despite the increased share count at 872.52M (+35.49M QoQ/ +196.14M YoY), implying the management’s ability to strategically grow its portfolio through acquisitions and/ or equity investments at profitable cash yields.
O’s Historical Performance
O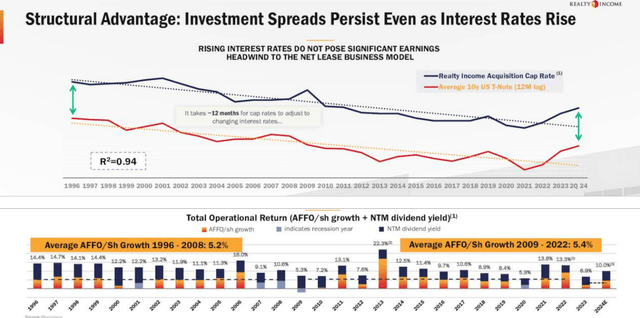
These numbers well mirror those observed over the past few decades, with O generating robust investment spreads and AFFO per share growth (aside from the recessionary years of between 2007 and 2013). This is despite the challenging few years after the unexpected COVID-19 pandemic and the drastic fluctuation in borrowing costs.
Even so, with those headwinds mostly behind us and a rate cut likely over the next few weeks, building upon the moderation by the European Central Bank in June 2024, we believe that the REIT remains well positioned to generate robust growth.
For example, O has reported $598M of global investment volume at an initial weighted average cash yield of 7.8%, with 54% of the volume attributed to the UK/ EU at a richer yield of 8.2% in FQ1’24.
The same has occurred in FQ2’24, at $805.8M/ 7.9% and at 46%/ 8.1%, respectively, with it implying the REIT’s ability to access low-cost capital while generating profitable spreads.
The ongoing generative AI and data center capex boom have also triggered a new growth opportunity, with O’s joint venture with Digital Realty Trust, Inc. (DLR) expected to generate a cash yield of 6.9% and contractual rental escalator of +2%.
With DLR still reporting higher rental pricing and growing renewal spreads, it is unsurprising why numerous data center REITs have guided intensified capacity build outs “to maximize sellable capacity on the back of ongoing record demand.”
This is especially since Gartner has projected a robust growth in the global spending on public cloud services growth at a CAGR of +21.1% from $561B in 2023 to $823B by 2025, with “AI-related workloads driving a significant portion of this growth.”
As a result, it is unsurprising that O has already hinted at intensified data center investments with its existing and some new partners in the FQ2’24 earnings call, potentially growing “our high percent part of our portfolio in a meaningful way over the next few years.”
This is on top of the gaming industry where the REIT expects to generate robust yields thanks to the “very favorable leases,” building upon its stable and recession-proof portfolio across grocery/ convenience/ dollar stores/ quick service restaurants in the retail market and automotive/ home improvement stores in the industrial market.
The Consensus Forward Estimates
Tikr Terminal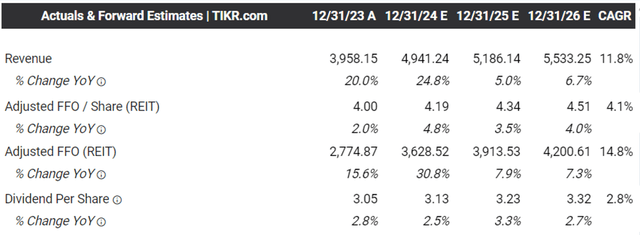
Based on O’s robust LTM operational return of over 11% (+3 points sequentially) and H1’24 AFFO per share growth to $2.09 (+5.5% YoY), we believe that it remains well on track to achieving the reiterated “operational return profile of approximately 10%, comprising an anticipated dividend yield close to 6% and AFFO per share growth of approximately +4.3%” in FY2024.
This may also be why the consensus have raised their forward estimates, with O expected to generate an excellent top/ bottom line growth at a CAGR of +11.8%/ +4.1% through FY2026.
This is compared to the previous estimates of +9.5%/ +2.7% and the historical growth of +20.8%/ +4.8% between FY2016 and FY2023, respectively, with the accelerating top/ bottom-line growth possibly attributed to the projected decline in the CPI and borrowing costs over the next few years – leading to higher investment volumes and portfolio growth.
So, Is O Stock A Buy, Sell, or Hold?
O 5Y Stock Price
TradingView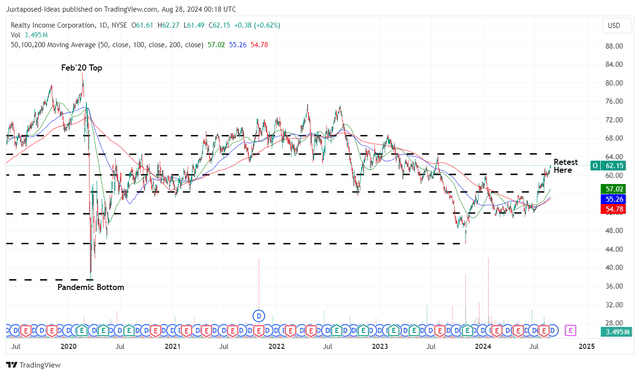
For now, O has had a rather promising breakout from the sideways pattern observed between late 2023 and mid-2024, with the stock appearing to retest its next resistance levels of $60s while running away from its 50/ 100/ 200 day moving averages.
O Valuations
Seeking Alpha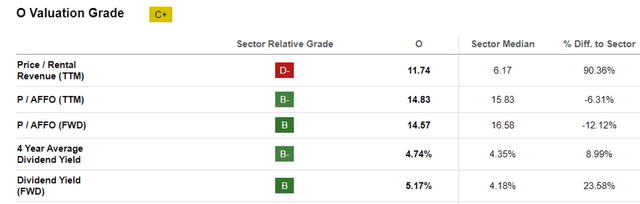
At the same time, O remains inherently undervalued at FWD Price/ AFFO valuations of 14.57x at the time of writing, compared to its 3Y pre-pandemic Price/ AFFO valuation mean of 19x, despite the notable upgrade from the October 2023 bottom of 11.40x.
Based on the factors discussed above, we maintain our belief that there remains an excellent upside potential of +37.8% to our bull-case long-term price target of $85.70, based on the consensus FY2026 AFFO per share estimates of $4.51 and an upward rerating to pre-pandemic valuations.
As a result of prospective dual pronged returns through dividend incomes (as discussed above) and capital appreciation, we are reiterating our Buy rating for the O stock here.
Read the full article here


")

