")
")


Written by Nick Ackerman
Cambria LargeCap Shareholder Yield ETF (BATS:LYLD) is a newly launched, actively managed exchange-traded fund (“ETF”). This ETF is focused on holding an equal-weighted portfolio of large-cap companies focused on delivering a relatively higher distribution yield to investors. In pursuing its portfolio allocation, the fund will not only just focus on dividends but also share repurchase and net debt paydown.
LYLD Basics
- Dividend Frequency: Quarterly
- Distribution Yield: TBD
- Expense Ratio: 0.59%
- Leverage: N/A
- Managed Assets: $5.848 million
- Structure: Active ETF
LYLD’s investment objective is to “seek income and capital appreciation.” To achieve this, the company will “invest, under normal market conditions, at least 80% of its net assets, plus borrowings for investment purposes, in equity securities, including common stock, issued by U.S.-based large capitalization publicly listed companies that provide high ‘shareholder yield’.”
This fund was launched on July 12, 2024. Similar to most newly launched ETFs, the fund’s managed assets are quite low at this time. However, thanks to a highly liquid portfolio of publicly traded companies (which we’ll discuss further below), liquidity shouldn’t be a problem for investors trying to build a position.
Cambria Investments is probably not very well-known, at least not to most investors—as they are a relatively newer investment firm that was founded in 2006. That said, they do have several ETF offerings already on the market. This isn’t their first “shareholder yield” fund either; in fact, their largest fund in terms of AUM is the Cambria Shareholder Yield ETF (SYLD). SYLD was launched in mid-2013 and listed at $1.227 billion in AUM.
In looking at the expense ratio, 0.59% is likely to cause some investors to pause. At this point, most investors are familiar with the massive, passively managed ETFs such as the SPDR S&P 500 (SPY), which come with a low expense ratio of just 0.09%. However, 0.59% is not too bad, particularly for an actively managed fund. Across all ETFs, where most are passively managed at this point—though actively managed ETFs seem to be gaining traction—the average expense ratio comes to 0.49%.
Methodology Breakdown
With LYLD, the ETF is actively managed, and that gives the managers some flexibility on where to invest. However, they are still using a model-based approach to achieve their investment objective. Of course, the first criterion is consistent with the fund name and stated in the fund’s basic investment policy, that is, focusing on companies classified as having a large market capitalization.
In other words, they will invest in companies primarily with a market cap of over $10 billion. This is one of the main differences from the SYLD ETF we touched on above, which focuses on mid-cap stocks.
Large caps tend to be more steady companies that can deliver free cash flow for the three pillars of the fund’s strategy. As companies grow and mature, they typically have more cash than growth opportunities for the business.
To define what exactly “shareholder yield” is, Cambria notes this:
Cambria defines “shareholder yield” as the totality of returns realized by an investor from a company’s cash payments for dividends, buybacks and debt paydowns. For purposes of this strategy, Cambria’s quantitative algorithm calculates a company’s shareholder yield by considering the following characteristics: (i) dividend payments to shareholders, (ii) return of capital in the form of share buybacks (i.e., a company’s repurchase of its own shares from the marketplace, which, in turn, reduces the number of outstanding shares for continuing shareholders or generates proceeds for existing shareholders), and (iii) paydown of a company’s debt (i.e., reducing a company’s outstanding debt).
That can be summed up more simply as we did at the opening of the article, that is, dividends, share repurchases and net debt paydown.
Along with this, Cambria is also employing Cambria’s “quantitative algorithm.” This helps to narrow the field down even further to their stated 50-100 expected holdings for the portfolio.
Cambria’s quantitative algorithm then factors in the remaining stocks’ debt paydowns and applies a number of value metrics to create a composite, including metrics such as, but not limited to, price-to-book (P/B) ratio, price-to-sales (P/S) ratio, price-to-earnings (P/E) ratio, price-to-free cash-flow (P/FCF or P/CF) ratio, and enterprise multiple (EV/EBITDA). The quantitative model then selects between 50 and 100 stocks for inclusion in the Fund’s portfolio that exhibit, in the aggregate, the best combination of shareholder yield characteristics and value metrics. The number of holdings in the Fund will be based on a number of factors, including the asset size of the Fund and the number of companies that satisfy Cambria’s quantitative measurements at any one time.
The managers will then look to equal-weight the holdings, but with natural market gyrations, the portfolio holdings will certainly shift over time. They intend to “adjust the fund’s holdings at least quarterly.” That said, they are still an actively managed fund and leave the door open to buy and sell more frequently. On that same logic, they note that despite what their model may say about a holding, they may sell a position if they feel it is overvalued or there is an opportunity elsewhere.
LYLD’s Portfolio
With the methodology laid out, here were the results in terms of sector breakdown at the time the fund launched. As one might expect, it ended up being a value-oriented leaning portfolio, with financials and energy comprising a significant portion of the overall fund’s weightings.
These are the sectors with the sorts of companies that focus more on the total cash return to investors, which includes both dividends and share buybacks. These are also the types of companies that often come in with attractive valuations relative to their heavier tech peers—tech here is coming in as the lowest weighting and is only at 4% at the time.
LYLD Sector Weights (Cambria)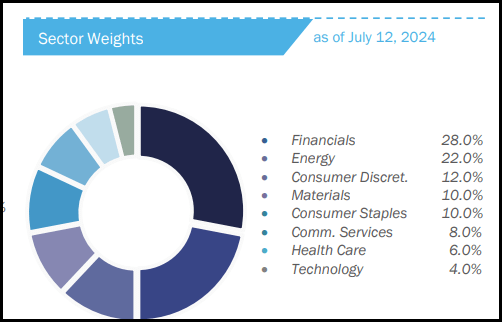
At this point, it doesn’t appear that they provide an updated sector weighting. As the fund garnered new capital within the first month, it is likely that the portfolio would have shifted.
Ycharts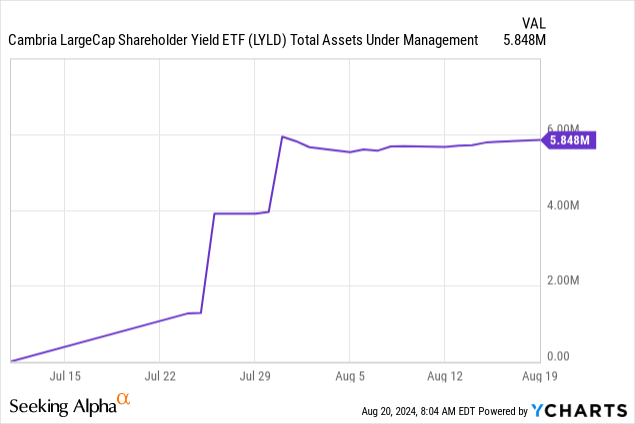
That said, we do get the latest holdings, as most passively managed ETFs provide. They provide a daily updated list, which isn’t unusual for ETFs, but being an actively managed ETF, that isn’t always the case. In total, they list 51 holdings for now, but two of those are cash and a money-market fund.
While they are looking to go with equal-weight positions roughly, it would appear that there are some meaningful weighting differences. This could be due to the overall market being relatively more volatile over the last month, or they are just going for a very rough equal-weight allocation. This is more noticeable between some of the fund’s largest holdings versus those on the bottom end.
That said, within the top ten, the weightings aren’t too far off, and the shifts here could easily be attributed to natural market share price movements.
LYLD Top Ten Holdings (Cambria)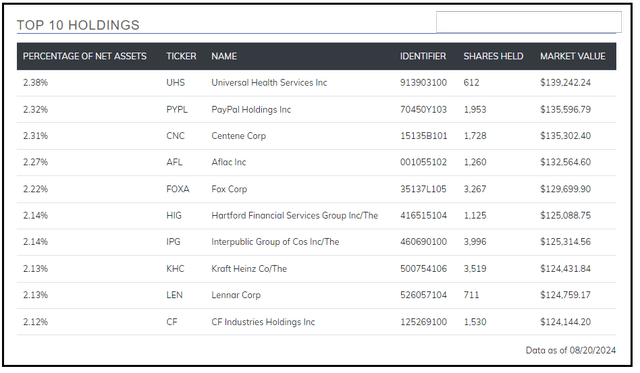
A dividend is one of the focuses of the shareholder yield; however, at this point, I have not seen an initial dividend announcement. However, we do know that they intend to pay a quarterly dividend to their investors. We also know that their other funds pay variable dividends, which is quite common for most ETFs, rather than level payouts.
Level distributions or managed distribution policies to pay a steady rate for extended periods of time are common among closed-end funds, but some ETFs also offer that distribution policy, too—LYLD just doesn’t appear like it will be one of them based on their other offerings.
With that said, we can get a rough idea of what sort of dividend yield LYLD could deliver based on the average of the top ten holdings. At the time of writing, that actually only works out to 1.76%—then we would have to factor in the expense ratio, and that comes down to ~1.17%.
Some folks might notice that some of these names don’t actually even pay dividends, which includes Centene Corp. (CNC) and PayPal (PYPL). Others pay quite a limited dividend yield: Universal Health Services (UHS) 0.35%, Aflac (AFL) 1.90%, Fox Corporation (FOXA) 1.36%, Hartford Financial Services Group (HIG) 1.69% and Lennar (LEN) 1.14%
On the higher dividend yield end, we have CF Industries Holdings (CF) with a 2.46% yield, materially higher than the current SPY yield of 1.22%. Then those that could be considered more high yield would be Interpublic Group of Cos (IPG) 4.21% and Kraft Heinz (KHC) 4.52%.
So overall, it does not appear that LYLD will be providing a high dividend yield, as we would likely fall between 1 and 2%—though that isn’t the only stated goal of the fund. The other two pillars of their approach are the share repurchases and net debt reductions.
Where PYPL and CNC don’t deliver a dividend, they deliver on other fronts. Both have seen meaningful net debt reductions—and in the case of PYPL, sizeable share repurchases driving shares outstanding lower.
Ycharts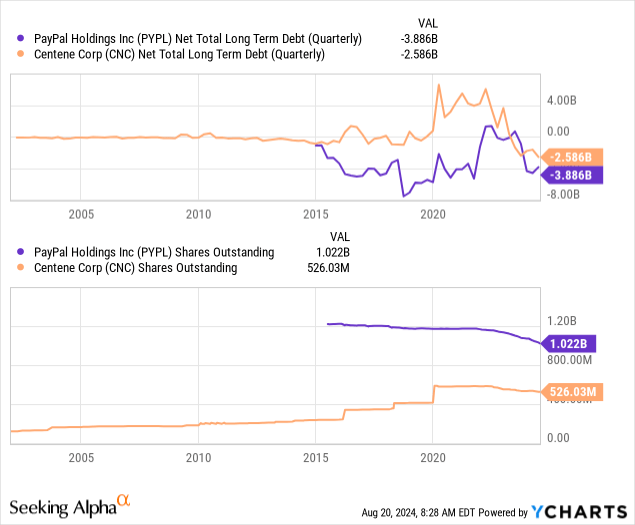
So where we don’t see a relatively high yield in terms of the dividend, we could end up with an ETF that sees more dividend growth over time.
Conclusion
LYLD is a newly launched ETF from Cambria. Though this is a new launch, it isn’t necessarily a new strategy deployed by this group. They have SYLD as a previous offering with a similar strategy, except more focused on mid-caps and 100 holdings. Historically, that strategy seems to have worked out fairly well.
For an extended period of time, SYLD closely correlated with the iShares Core S&P Mid-Cap ETF (IJH) and the SPDR S&P MidCap 400 ETF (MDY). Rebounding out of the Covid crash saw SYLD significantly outperform, really driving their total returns ahead of the other two ETFs.
Ycharts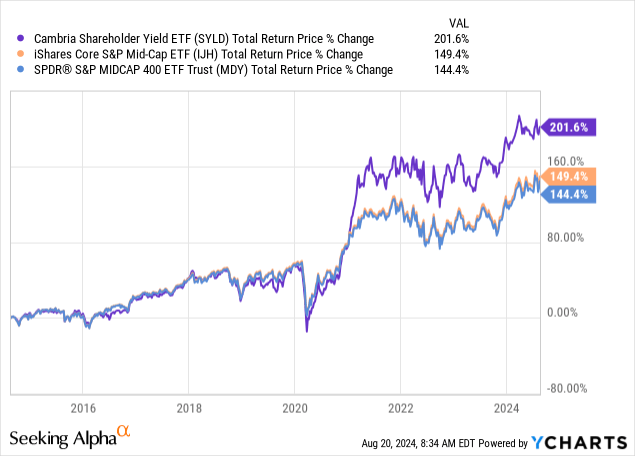
After that point, over the last 3 years, we once again see a fairly close total return performance.
Ycharts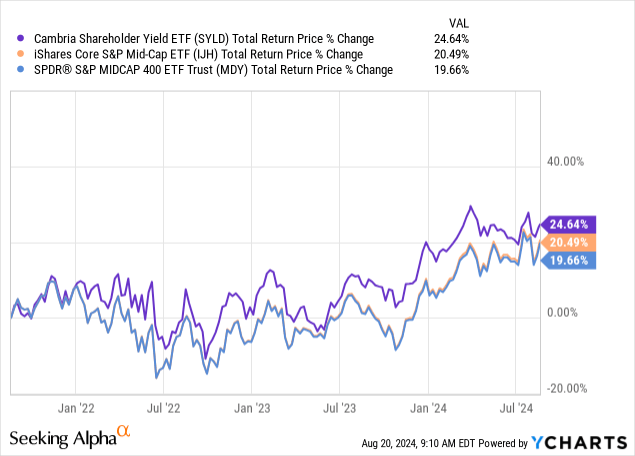
We only have a very short history, with LYLD being just over a month old. So, we don’t have any historical track record to draw from here. Whether this ultimately means LYLD will work out similarly to its sister fund in the future is unknown. The fund is positioned very differently than something like SPY, more focused on value rather than growth. With that, we shouldn’t expect to see a high correlation compared to what we see SYLD’s offering against the passively managed mid-cap ETFs.
Read the full article here
")
")


