")

")


")
A handful of sectors finished last Friday at fresh 52-week highs. Along with Financials, Utilities, Real Estate, Industrials, and Consumer Staples, the underperforming Health Care space has been on a recent run up. Eli Lilly (LLY) is by far the MVP this cycle, now with a market cap of more than $850 billion and up 72% from a year ago. LLY’s rally has left other pharma names and medical device companies in the dust, and I’m hesitant on one industry ETF.
I have a hold rating on the iShares U.S. Medical Devices ETF (NYSEARCA:IHI). The chart setup is quite strong, but its valuation is high considering its EPS growth projection. Moreover, secular headwinds could be in play if GLP-1 weight loss and diabetes drugs prove to help prevent long-term illness and other chronic medical conditions.
1-Year ETF Performances: Health Care In Focus, +18% YoY
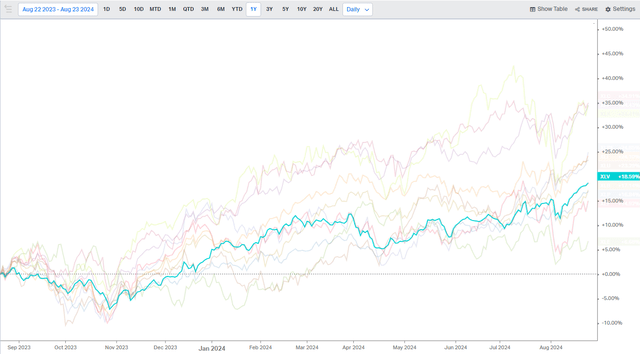
Koyfin Charts
According to the issuer, IHI offers investors exposure to U.S. companies that manufacture and distribute medical devices. The ETF gives targeted access to domestic medical device stocks and is used by investors to express an industry view within the Health Care sector. IHI seeks to track the investment results of an index composed of U.S. equities in the medical devices sector.
IHI is a large ETF with more than $5 billion in assets under management as of August 23, 2024. It carries a moderate 0.40% annual expense ratio while the fund’s forward dividend yield is paltry at barely more than 0.5%. What’s more, share-price momentum has been sour this year, though IHI has rallied significantly off its August low. I will detail key price levels on the chart to monitor later in the article.
IHI is also considered a risky fund when interpreting Seeking Alpha’s ETF Grade quant system. The historical standard deviation is modestly elevated while the portfolio is highly concentrated with more than 40% of the fund’s assets in its top 10 positions. To its credit, liquidity metrics are favorable given average daily volume of almost 700,000 shares and a 30-day median bid/ask spread of just two basis points, per iShares.
Turning to the portfolio, the 4-star, Bronze-rated ETF by Morningstar has an allocation that plots in the upper-right of the style box, indicating its large-cap growth bent. There is a material weighting in SMID caps, too. More than 40% of the fund is away from large caps, which adds cyclical risks to the fund.
And with its high 25.4 price-to-earnings ratio, IHI is not the cheapest ETF around, particularly considering that long-term EPS growth is 10.4, resulting in a PEG ratio of nearly 2.5. The S&P 500’s PEG is closer to 1.5 today, for perspective. With a low yield and somewhat soft absolute momentum, IHI has hurdles to overcome, in my view.
IHI: Portfolio & Factor Profiles
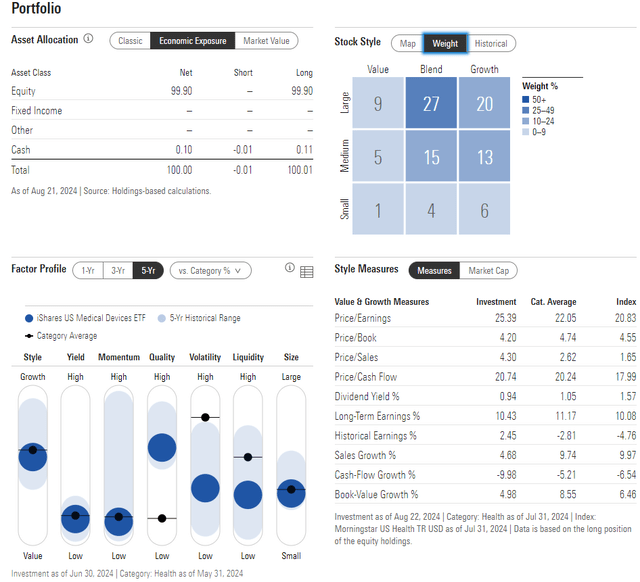
Morningstar
This Health Care sector fund is risky considering its concentration. Keeping a close watch on its three largest positions is critical. Abbott Laboratories (ABT), Intuitive Surgical (ISRG), and Stryker Corporation (SYK) can have the potential to move IHI around, particularly during earnings season. Overall, 73% of the ETF is invested in its top 10 assets.
IHI: Holdings & Dividend Information
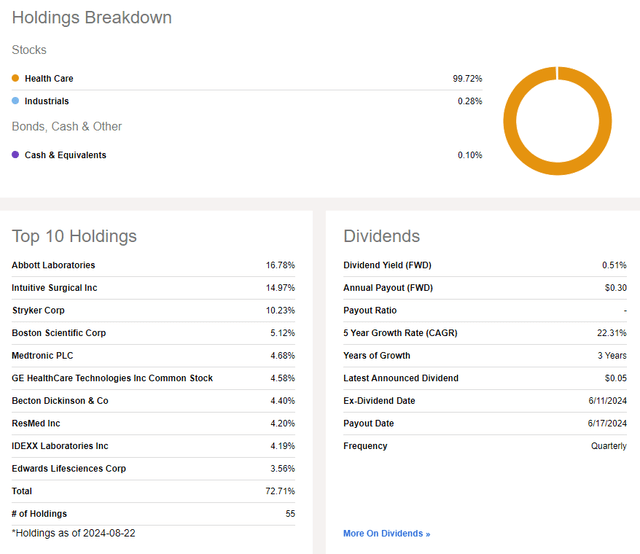
Seeking Alpha
Something else to weigh is seasonality. The August through October stretch has historically produced weak, even negative, returns. More bullish trends often take shape beginning in November, and lasting through July. So, being patient today is prudent in my eyes.
IHI: Weak Seasonal Trends Into Early Q4
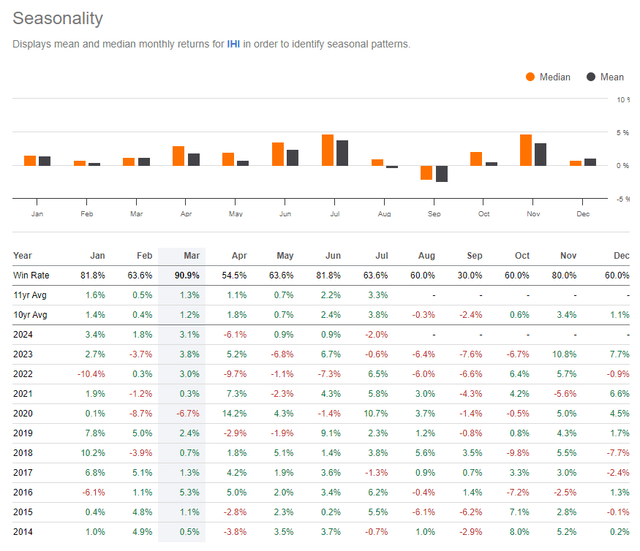
Seeking Alpha
The Technical Take
With a lofty valuation, moderate EPS growth, and soft absolute momentum, IHI’s technical situation is intriguing. Notice in the chart below that the fund may have completed a cup and handle pattern. A breakout above $59 would help support the case for an upside measured move price target to about $73 based on the $14 range height from the 2023 through mid-2024 consolidation range.
But with IHI still slightly below its March peak, the onus remains on the bulls to carry the ETF to new highs. I like, however, that there is now a high amount of volume under the latest price. Additionally, take a look at the RSI momentum oscillator at the top of the chart – it has just recently broken out to its best level since the first quarter. It’s thought by technicians that momentum leads price, so this is a bullish factor. Finally, with a rising long-term 200-day moving average, it is another sign that the bulls are getting ready to take IHI to fresh multi-year highs.
Overall, $59 is resistance while $53 to $54 is support.
IHI: On Breakout Watch, $73 Target Long-Term, $63 Target Near-Term
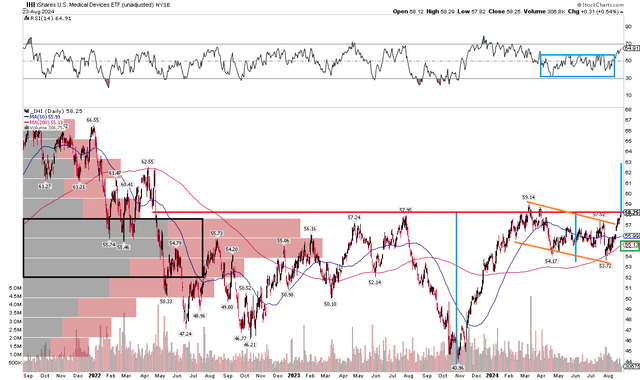
Stockcharts.com
The Bottom Line
I have a hold rating on IHI. While I see favorable trends on the chart, its valuation is lofty right now, and the ETF has lagged the broader market’s gains.
Read the full article here
")
")


")
