
")

")


As is very well known, technology and mega-cap stocks have ruled the day, or ruled the past decade, delivering substantial outperformance as compared to smaller companies over the past 10 years, past 5 years, past 3 years – whatever period one would like to choose.
Obviously, there’s some selection bias at play, as outperforming companies have a greater chance at becoming large/mega-caps as their businesses and valuations grow. Nonetheless, it’s plain to see that small caps have been long-term laggards.
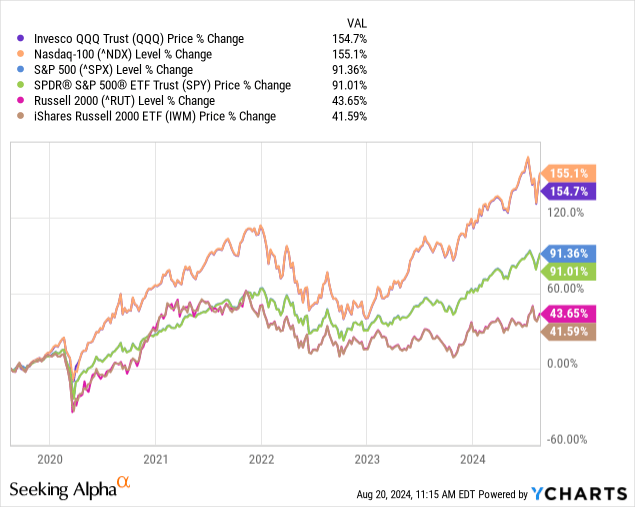
Here’s the 5-year view:
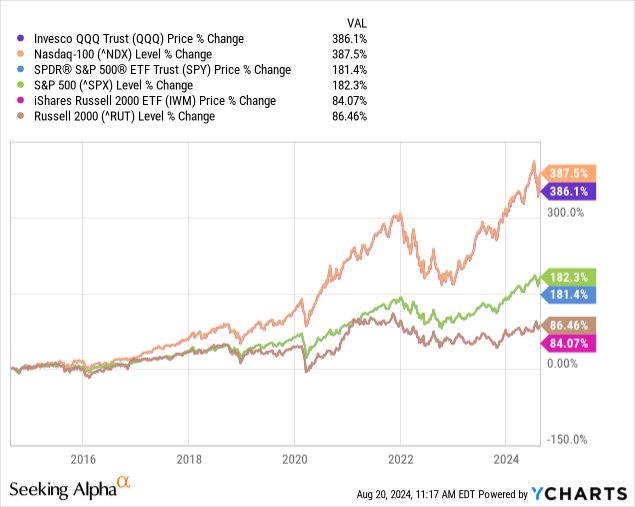
Here’s the 10-year view:
While there’s been plenty of talk from those witnessing a shift in leadership in recent months, any catch-up by the small-cap companies has amounted to little more than a blip. Over the past 2 months, I see the Invesco QQQ Trust (QQQ) and Invesco Nasdaq 100 ETF (QQQM) having traded essentially flat, while the iShares Russell 2000 ETF (NYSEARCA:IWM) has gained a little more than 7.5%.
When your favored asset class has been lagging for very long periods of time, it’s more likely that you’ll jump and scream (just like for ice cream) for the smallest observable pivot.
But are small companies truly positioned to deliver, fundamentally speaking? I wanted to take a closer look before considering any expanded investment in small caps for my portfolio.
Declining Interest Rates / Interest Costs
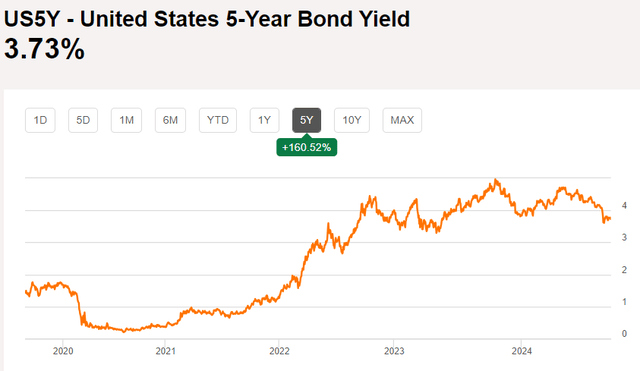
One of the first things I wanted to look at was capital structure. The rise of bond yields to multi-decade highs has certainly placed an albatross around the neck of those who are dependent on debt financing. Those companies who are emerging and need to invest heavily to achieve a sustainable business are most vulnerable.
Seeking Alpha
Looking simply at the sector weights tells a story. I took a look at the average debt/equity ratios by sector, as presented by Eqvista.com, and then applied these ratios against the sector weightings for both QQQ and IWM. Here is what I found:
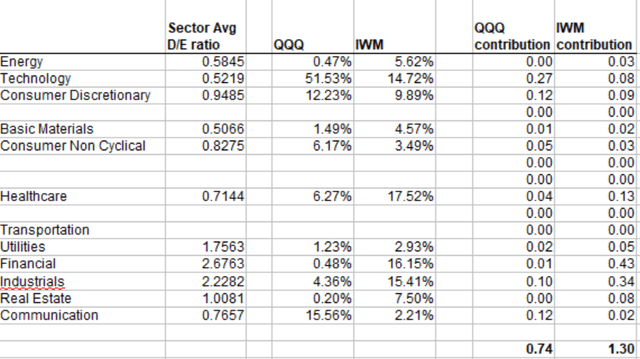
author, using data from Eqvista.com
Based on the average Debt/Equity ratios by sector, I’ve derived an estimated average D/E ratio of 1.30x for the Russell 2000, as opposed to just 0.74x for the Nasdaq 100. That’s a truly significant difference, and illustrates how much more likely small-cap companies have been hamstrung by higher debt costs in recent years.
“Now wait,” you might ask, “isn’t that cherrypicking, since the Nasdaq is nearly a proxy for tech stocks“? Perhaps, so I’ve done performed the same examination between IWM and the SPDR S&P 500 ETF Trust (SPY), proxy for the S&P 500 (SP500) (SPX), and it tells very much the same story, but to a somewhat lesser degree.
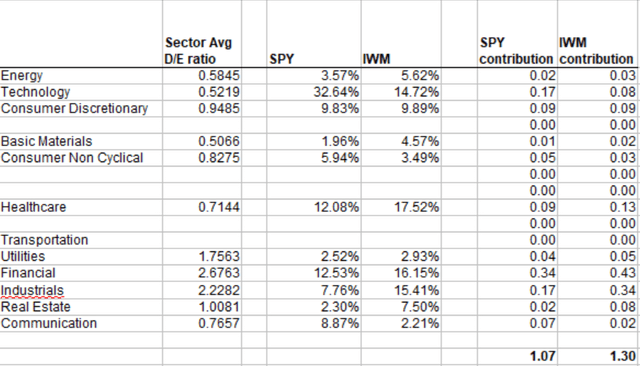
author, using data from Eqvista.com
The straightforward conclusion here is that small-cap stocks in general, at least as represented by the Russell 2000 (RTY) as a proxy, are more heavily weighted in sectors that tend to carry more debt financing. That has most certainly been a burden over the last few years.
Going forward though, with interest rate projections declining, small caps may be set to benefit in an outsized way.
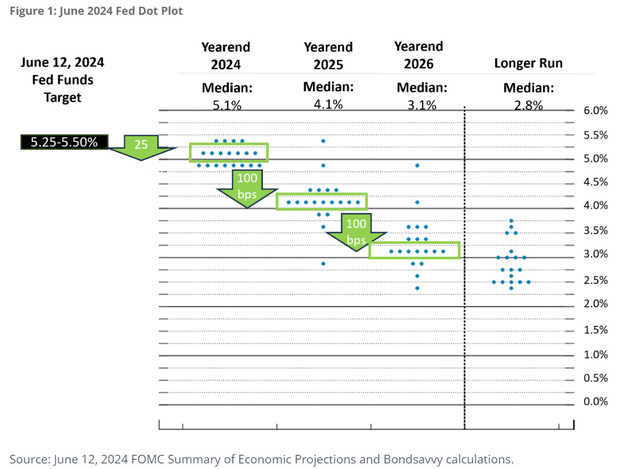
Bondsavvy.com
For investors wondering whether I believe long-term yields are headed lower, I haven’t been counting on this, as least as recent as late-July. If Fed Funds rate cuts put the economy on more stable footing, the yield curve may normalize and longer term debt yields may see little change.
However, it’s important to remember that many small companies rely on short-term borrowings instead of (or in addition to) long-term debt, and may benefit meaningfully from a lower Fed Funds rate as opposed to more established firms.
Disclaimer: The ‘average D/E’ modeling presented above reflect estimations only. For example, I did not research the debt level for every single company in the Russell 2000 to calculate a firm number.
Dividend Yields
Although investors would almost never suspect so, the Russell 2000 is currently yielding a slightly higher dividend than the S&P 500.
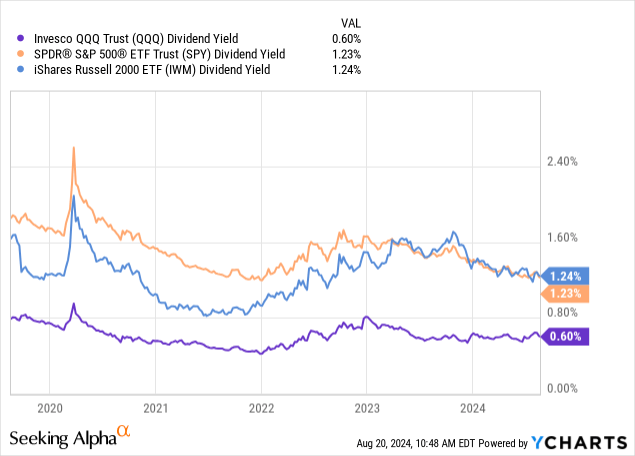
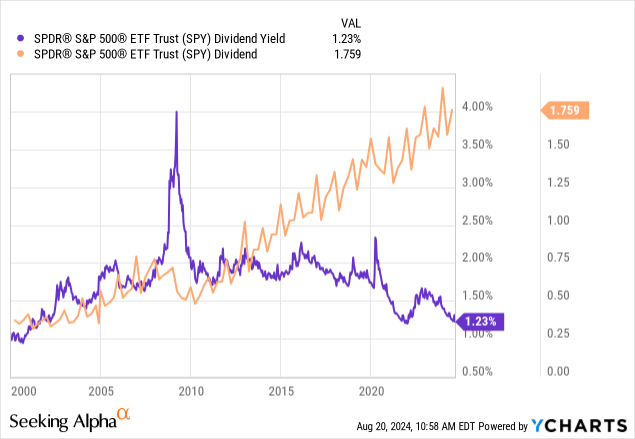
This is quite fascinating, given that mature, established companies have an enhanced ability to return cash to shareholders, while small and emerging companies generally do not. However, given its long-term outperformance, the S&P 500’s yield is essentially at a 22-year low! The constituents of the S&P 500 have indeed been increasing their dividends, but at a significantly lower rate than the price appreciation of their stocks.
The 2 factors analyzed above definitely point to a relative advantage for small-cap stocks at this juncture.
What Are the Concerns/Risks For Small-Caps?
Increasing one’s portfolio exposure to small-caps doesn’t come without risk, however. Here are the things that I believe merit consideration and monitoring:
- For those investing in small-caps through funds/ETFs, you’ll be gaining substantial exposure to the Industrials and Financials sectors. These are 2 sectors prone to struggles in a weakening economy. So any economic releases that point to a possible recession may put additional pressure on small-cap stocks.
- These same 2 sectors, Industrials and Financials, are heavily linked as well, as manufacturing firms and other capital intensive companies tend to carry a significant about of debt, much of it lent via bank arrangements (again, especially for smaller companies).
- Higher Debt/Equity ratios also makes companies more susceptible to liquidity events. Such fears may actually deliver great contrarian buy opportunities, but any actual recession could cause bankruptcies in the small-cap space.
- Any investor selecting individual small-cap companies loses the diversification benefits of an ETF or fund.
Summing Up
Per Biryini Associates, the Russell 2000 was recently trading at a P/E of about 29.5x, more than 1 turn lower than the Nasdaq 100, but about 5 turns higher than the S&P 500. Investors need to keep in mind that many companies within the Russell 2000 are unprofitable, which obviously makes the index look expensive.
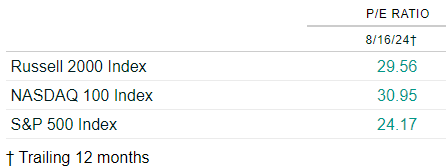
Biryini Associates, reported by Barrons
Following my assessment of some of the broader indicators, and some recent profit taking in my holdings, I’ve started to reallocate capital towards the small cap space. I believe that lower rates will herald sunnier times for smaller companies, while the dividend rate paid on the Russell 2000 is quite attractive (on a relative basis).
Small cap stocks are popularly measured via IWM, the iShares Russell 2000 ETF. The largest small-cap ETF though, as indicated by etfdb.com, is the iShares Core S&P Small-Cap ETF (NYSEARCA:IJR). Vanguard’s primary offering in the space is the Small-Cap Index Fund ETF (NYSEARCA:VB). All 3 ETFs track very closely in terms of performance.
Similar to large-cap ETFs, management expenses are very low for the small-cap offerings. With that said, it’s worth noting that IWM carries a management fee of 0.19%, versus about 0.05% for the other 2 major small-cap ETFs listed above.
Read the full article here

")

")

