


Introduction
Last month, I wrote a tribute to my mentor, Harry. As I have mentioned so many times, Harry was a buy-and-hold forever style of investor. He focused on dividend-paying stocks, and those dividends were “secure.” This led me to wonder how this might work in today’s world of ETFs. I will show you that a buy-and-hold forever strategy can work if one operates within the ETF universe.
Using a FactSet screener, I searched for large-cap ETFs classified as US large-cap and focused on equity income. For this experiment, I backtested it from July 1, 2014, to June 30, 2024. These are the eight ETFs that passed my screen:
- First Trust VI: NASDAQ BuyWrite Income (XNAS: FTQI)—This ETF uses an option strategy by writing covered call options on the Nasdaq-100 Index.
- iShares: Core High Dividend (ARCX: HDV)—This fund tracks the investment results of the Morningstar Dividend Yield Focus Index.
- ProShares: S&P 500 Dividend Aristocrats (BATS: NOBL)—NOBL tracks the investment results of the S&P 500 Dividend Aristocrats Index.
- Invesco S&P Ultra Dividend Revenue (ARCX: RDIV)—This basket of securities is based on dividend payers from the S&P 900.
- First Trust VI: Rising Dividend Achievers (XNAS: RDVY)—RDVY corresponds with the NASDAQ US Rising Dividend Achievers Index.
- Schwab Str: U.S. Dividend Equity ETF (ARCX: SCHD)—mirrors the total returns of the Dow Jones U.S. Dividend 100 Index.
- ALPS Sector Dividend Dogs (ARCX: SDOG)—replicates the return of the S-Network Sector Dividend Dogs Index.
- Invesco S&P 500 High Dividend Low Volatility (ARCX: SPHD)—as the name implies, this fund invests in high-yielding stocks with low volatility.
This has been a low beta portfolio (0.77) and has a current average yield of 4.30%. The average yield for the past five years has been 3.68%.
Three companies are held by five of these funds. They are as follows with their average weighting:
- Exxon Mobil Corporation (XNYS: XOM)—2.00%
- AbbVie Inc. (XNYS: ABBV)—1.93%
- Chevron Corporation (XNYS: CVX)—1.66% Portfolio Performance
To determine the performance of this portfolio, I decided never to rebalance. I wanted to replicate something my mentor would have done, which is nothing after the initial investment purchase. I hypothesized how an investor’s overall investment would have performed if they had chosen a true buy-and-hold approach. This would require one to initiate an investment, walk away, and enjoy the dividends. I compared the portfolio’s performance to the SPDR S&P 500 ETF Trust (ARCX: SPY).
Equity Income v. S&P 500 (Author)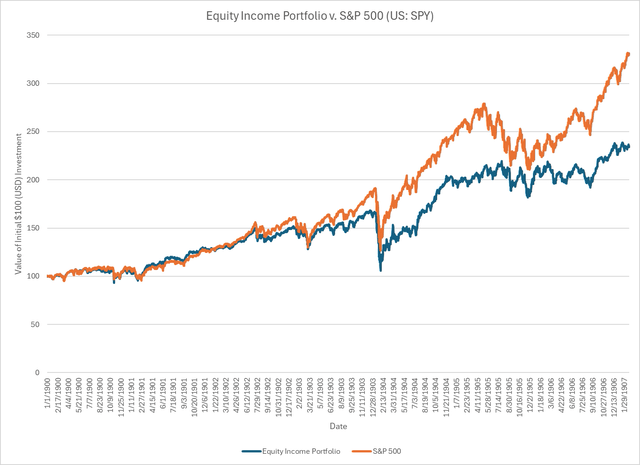
|
Risk Measures |
(07/01/2014-06/30/2024) |
Equity Income Portfolio |
(ARCX: SPY) |
Excess |
|
Average Return* |
10 |
8.91% ± 15.99% |
12.68% ± 16.53% |
-3.77% |
|
Up Markets** |
92 |
11.42% |
16.49% |
-5.07% |
|
Down Markets** |
17 |
-2.01% |
-7.64% |
5.63% |
|
Return/Risk Z |
0.56 |
0.77 |
-0.21 |
|
|
Inflation Z |
0.37 |
0.59 |
-0.22 |
|
|
*Average Return is based on geometric results |
||||
|
**Up/Down Market data is based on arithmetic results |
||||
As one can see, the S&P 500 index investment far outperformed the sample equity income portfolio in almost every measure. It had a better overall return (12.68% v. 8.91%), was more likely to be profitable (0.77 v. 0.56), and was more likely to beat an inflation rate of 3% (0.59 v. 0.37). The only measure where our dividend investor came out on top was during any 12-month down periods (2.01% v. -7.64%). Given that, one would be better off investing in the index instead of chasing after dividends, right? Well, not so fast.
Dividend Investors Do Not Care
If I had asked Harry how his overall portfolio performed, he would not have cared. He would not have known his overall return, his standard deviation, his Sharpe Ratio, his alpha, or his beta. He only cared about the income he was generating from his investments. The dividends were his paycheck.
Assuming a $10,000 investment, our sample portfolio would have generated an initial 12-month cash flow of $633.41 or a 6.33% yield. By the time the second quarter of 2024 was completed, those same investments would have generated distributions totaling $1,059.65. This would have been a 6.27% yield (TTM) and 10.60% of the initial investment. The total payouts generated would have been $8,530.10 for the ten years. The dividends grew a persistent 6.89% per annum, well ahead of the inflation rate of 2.8% over the same period.
Equity Income Portfolio Dividend History (Author)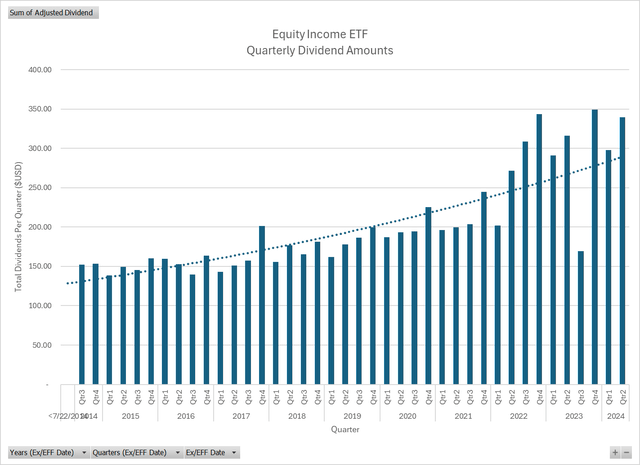
One of the lessons I learned from Harry was that for the dividend investor, especially those where those distributions are actual income, increasing dividends is the most important thing for their investment approach. By the way, the underlying investments had a price increase of 69.0% or 5.39% per annum.
Which ETFs Should I Buy Now?
If one were to screen for Equity Income ETFs and use some basic Morningstar and Lipper Leader searching, the best funds are:
|
Ticker |
Yield (%) |
Morningstar Rating |
Morningstar Medalist Rating |
Lipper Leader Average |
|
Invesco DJIA Dividend (ARCX: DJD) |
3.28 |
3-Star |
Bronze |
4.0 |
|
Siren: DIVCON Leaders Dividend (BATS: LEAD) |
1.02 |
4-Star |
Negative |
4.2 |
|
ProShares: S&P 500 Dividend Aristocrats (BATS: NOBL) |
2.11 |
4-Star |
Bronze |
3.8 |
|
SPDR Russell 1000 Yield Focus (ARCX: ONEY) |
3.11 |
4-Star |
Silver |
4.4 |
|
ALPS O’Shares U.S. Quality Dividend (BATS: OUSA) |
1.63 |
4-Star |
Neutral |
4.2 |
|
WisdomTree: PutWrite Strategy (ARCX: PUTW) |
10.94 |
4-Star |
2.6 |
|
|
Pacer Metaurus US Large Cap Dividend Multiplier 400 (ARCX: QDPL) |
5.64 |
4-Star |
Bronze |
3.8 |
|
First Trust VI: Rising Dividend Achievers (XNAS: RDVY) |
1.89 |
5-Star |
Bronze |
4.6 |
|
Schwab Strategies: U.S. Dividend Equity ETF (ARCX: SCHD) |
3.51 |
4-Star |
Gold |
4.6 |
|
T. Rowe: Equity Income ETF (ARCX: TEQI) |
1.90 |
3-Star |
Silver |
4.6 |
|
Average |
3.50 |
When looking at Morningstar ratings, it is important to note that they are based on risk-adjusted for three-, five-, and ten-year periods. The ratings are based on performance against a peer group. The medalist ratings assume that Bronze-rated ETFs will generate positive alpha, whereas the Silver-rated ETFs are better than average investments with positive alpha, and Gold-rated ETFs are in the top 15% of investments.
Lipper Ratings are based on quintiles where a rating of 3 is the middle quintile, while a rating of 5 is in the top 20%. Lipper focuses on total return, consistent return, preservation, tax efficiency, and expense. I showed the average score. With sets of ratings, I maintained the ETFs that had a better than average for the Morningstar Rating, Morningstar Medalist Rating, or the Lipper Leaders average.
All of these ETFs are excellent choices for the dividend hunter. I need to point out that I am not endorsing one ETF over the other. It is nice, though, for one to find a variety of choices where they can invest their money and see that it is managed toward the goal of generating income.
My Take
Harry was very diligent in his investing strategy. He was a voracious reader and consumed annual reports the same way one might read a fiction novel. That was his hobby, as well as his wealth management. Outside of rejecting any investments that did not pay a dividend yield greater than 2%, I have no idea what he would have thought about this approach. For the rest of us, we are busy with life, where investing is just part of it. It is nice that we have the option to exercise a buy-and-hold (forever?) approach and generate and handsome quarterly cash flow.
Have fun and be abundant.
Read the full article here


")
