")


By Albert Grosman & Brian Lund, CFA
Small Value Falls Amid Concentrated Leadership – Market Overview
The second quarter proved exceptionally challenging to navigate for small cap stocks, as investors continued to narrow their focus on a small handful of AI beneficiaries and bitcoin plays, while economic deceleration and a higher-for-longer interest rate outlook weighed on the rest of the market. The result was a broad retreat for small value, with all 11 Russell 2000 Value Index sectors posting negative returns and a -3.64% decline for the overall index. Small cap growth and core indexes fared only marginally better, with the Russell 2000 Growth Index returning -2.92% and the core Russell 2000 Index returning -3.28%.
Portfolio Performance
The ClearBridge Small Cap Value Strategy underperformed its benchmark in the second quarter, as detractors in the materials and industrials sectors overcame positive contributors from our health care holdings.
Stock selection in the materials sector weighed on relative performance. Eagle Materials (EXP), last quarter’s top-performing holding, pulled back as macro uncertainty and higher-for-longer interest rates resulted in weaker industrial and construction outlooks. However, we continue to have high conviction that the company’s strong pricing power in its cement business and cost advantages versus its peers in its wallboard business should allow Eagle to continue to maintain attractive returns on capital.
Stock selection in the industrials sector was a significant detractor from performance, as many of our holdings felt the impact of economic deceleration. For example, Forward Air (FWRD), an asset-light freight and logistics company, faced pressure from weak end markets, resulting in excess carrier capacity and pricing pressures. Additionally, the company has struggled to unlock synergies from its acquisition of Omni Logistics in the first quarter, further fueling concerns about increased leverage. Given the lack of insight into the company’s general strategic direction under its new CEO, we ultimately decided to sell the position.
Health care results lifted relative performance during the period and included our top two individual performers in Lantheus (LNTH) and newer portfolio addition Corcept Therapeutics (CORT). Lantheus, which makes diagnostic and therapeutic products that help clinicians diagnose and treat heart, cancer and other diseases, saw its share price rise on strong first-quarter results. Corcept, which was added last quarter, announced that it had successfully reached its main goal in its Phase 3 trial for its treatment for patients with Cushing’s syndrome. We believe the new drug’s efficacy and safety significantly increases its likelihood of approval and offers an attractive growth runway via possible extension into other indications.
Portfolio Positioning
New positions in the quarter were from a variety of sectors. Criteo (CRTO), in the communication services sector, provides digital advertising technologies that help drive clients’ e-commerce businesses. While the company was previously reliant on third-party cookies to help optimize its products, management has spent the past five years pivoting away from this technology and focusing on building a leading presence in the burgeoning retail media space. We believe this transformation has reached a tipping point, and that the inherent growth opportunities in this new end market represent a higher growth rate than is currently reflected in the company’s valuation.
We also added a new position in SkyWest (SKYW), a regional airline operator. The company reported strong quarterly earnings as its pilot attrition declines and fleet utilization improves. We believe that SkyWest continues to find opportunities to deploy capital in a value-accretive manner, acquiring more planes under long-term contracts. We think earnings should hold up in a potential recession and perhaps even improve further if major airlines reduce capacity and more pilots become available for SkyWest.
Meanwhile, we exited our position in Unum, in the financials sector, which provides financials insurance products including long- and short-term disability, group life and accidental death insurance as well as group pension products. With the company’s market cap reaching the upper bounds of the small cap category and its share price nearing our target valuation, we elected to exit the position in favor of other opportunities with greater return potential.
The Rising Risk from CEO Compensation
Given the tumultuous and sentiment-driven market conditions, it can be easy to overlook the advantages that a rigorous, fundamental investment philosophy offers investors. There are many criteria that we look at in assessing whether a company is a “good” investment – some of which are more apparent than others. While things like cash flow generation, the strength of a company’s balance sheet and its long-term strategy are obvious considerations, one of the most important – but less talked about – considerations is how these companies treat their shareholders. While the rise of environment, social and governance (ESG) criteria has helped cast a light on how companies are tackling the “E” through things like reduced emissions, and the “S” through things like providing workers living wages, less attention has been applied to the “G.” Meanwhile, there has been a rapid and escalating rise in CEO compensation.
“We always take stock-based compensation into account when evaluating a company.”
A recent report from Equilar estimates that the spread in compensation between the CEO and the median worker at the largest 100 companies in America reached 312:1 in 2023, with the top 100 CEOs realizing a 20% increase in median total compensation actually paid.1 Much of that comes from stock awards, which many companies ignore when reporting adjusted earnings and many investors ignore when calculating valuations. However, those awards are not free. Stock-based compensation decreases the per-share value of future cash flows and represents a transfer of future value creation from the existing shareholders to top management. Ultimately, the better the company does, the more value management gets over other shareholders. And it is management: while employees often get grants, the vast majority go to the bosses.
How much value are we talking about? Public companies gave $700 billion in stock-based compensation from 2005 to 2014. From 2014 to 2023, that figure rose to $1.6 trillion and shows no sign of slowing (Exhibit 1).
The strength in the stock market adds significantly to that enormous transfer of wealth, which one could argue is good for shareholders. But is it causal? That is, did the stock market do well because CEOs got large stock grants? Are the CEOs just the lucky recipients of a windfall when the market goes up and their employees perform well? Or do they require huge grants to do their jobs that no one else could possibly do as effectively?
Exhibit 1: Stock-Based Compensation Accelerates
As of May 31, 2024. Source: Kailash Capital Research.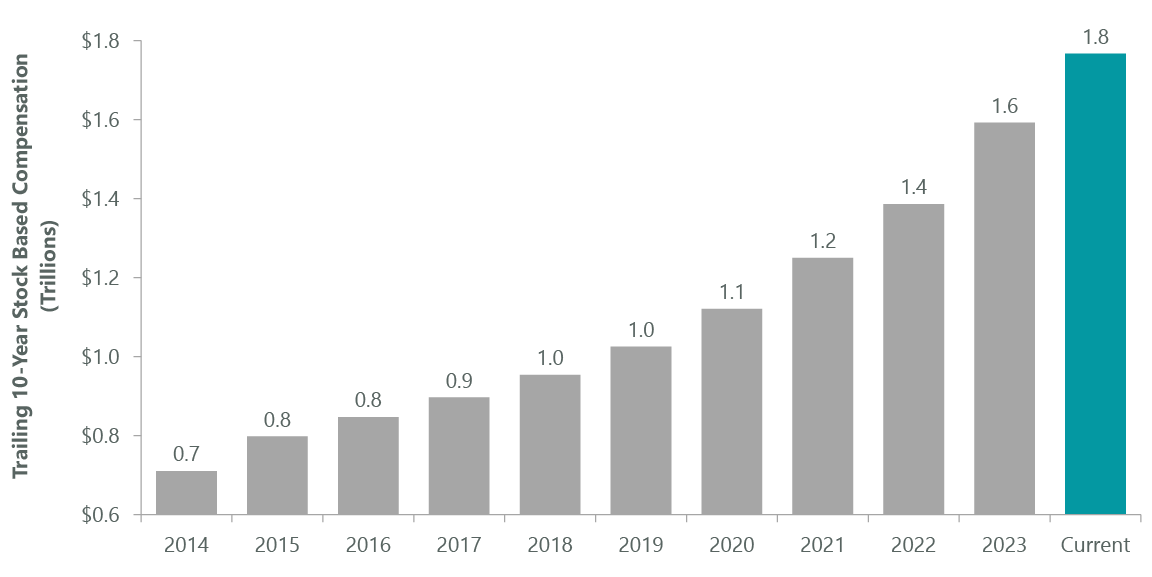
Tesla, and most of its shareholders, certainly think the latter is true. In 2018, Tesla’s board of directors crafted a pay package for CEO Elon Musk that would award him 12 tranches of 10-year, fixed-price options on 1% of company stock for every $50 billion in market cap the stock added. In total, the options would be for 304 million shares of the company at $23.34 a share. He would receive no other compensation, until or unless the board decided otherwise. Shareholders approved that pay package, and the stock added all that market cap and more, giving Musk the right to buy 10% of the company for $50 billion less than it was worth, adding to his existing 13% stake. Minority shareholders sued, and a court sided with them and expunged the package in January 2024. “The process leading to the approval of Musk’s compensation plan was deeply flawed,” ruled Judge Kathaleen McCormik of the Delaware Court of Chancery as part of a 200-page decision. It seemed like a long-awaited check on excessive compensation to one individual for the achievements of an entire company.
But no. Tesla (TSLA) responded by proposing that they reincorporate the company in Texas to avoid Delaware courts and reinstate the pay package as previously outlined. Proxy advisory firms recommended shareholders reject the deal, noting that owning 13% of the company should incentivize Musk sufficiently. However, approximately 70% of shareholders, including some large index fund managers, voted to reinstate the package, this coming merely one week after reports surfaced that Musk had diverted precious Nvidia (NVDA) chips away from Tesla toward other companies he controls. It also came after significant production issues at Tesla, such as multiple recalls on the new Cybertruck and fatalities from Autopilot.
The most egregious issue here is the lack of concern for shareholders and proper governance that large index fund managers exhibited. They allowed a CEO to overstep shareholders in their funds, despite concerns from proxy advisors and overt acts to disadvantage Tesla in favor of other companies he controls. Is Musk – or any CEO – really worth this level of deference and compensation? Is Tesla’s success really so reliant on one person? More than one hero CEO has subsequently been shown to be just in the right place at the right time.
With the economy seemingly slowing and extreme concentration in the market, we believe that the risks posed by this growing, but largely unaddressed, threat requires even greater attention and understanding than are outside the purview of passive investors or large index managers. In managing our strategies, we always take stock-based compensation into account when evaluating the governance of a company, as well as the amount going to top executives and the independence of the board.
Outlook
The small cap Russell 2000 Index has underperformed the large cap Russell 1000 Index by more than 10 percentage points annually since the end of 2020. Within small cap, growth has outperformed value by almost 8 percentage points annually over that period. Those trends have been in place since the end of 2016. With large cap valuation spreads reaching record levels, we think the odds of small cap and small cap value outperformance over the next few years are high. To that end, we continue to apply a disciplined process to stock selection and refine our positioning in our goal to deliver attractive, long-term returns over a full market cycle.
Portfolio Highlights
The ClearBridge Small Cap Value Strategy underperformed its Russell 2000 Value Index benchmark during the second quarter. On an absolute basis, the Strategy had losses across nine of the 11 sectors in which it was invested during the quarter. The leading contributor was the health care sector, while the industrials sector was the largest detractor.
On a relative basis, overall stock selection detracted from performance but was mildly offset by positive contributions from sector allocation effects. Specifically, stock selection in the materials, industrials, energy and consumer discretionary sectors weighed on performance. Conversely, stock selection and an underweight allocation to the health care sector proved beneficial.
On an individual stock basis, the biggest contributors to absolute returns in the quarter were Lantheus, Corcept Therapeutics, Primoris Services (PRIM), Murphy USA (MUSA) and Anterix (ATEX). The largest detractors were Olin, Bloomin’ Brands (BLMN), Wabash National (WNC), Eagle Materials (EXP) and Hillman Solutions (HLMN).
In addition to the transactions listed above, we initiated new positions in Allegiant Travel (ALGT) in the industrials sector, Scholar Rock (SRRK) and Acadia Healthcare (ACHC) in the health care sector, MP Materials (MP) in the materials sector and Abacus Life (ABL) in the financials sector. We exited positions in QuidelOrtho (QDEL) in the health care sector, Veritex (VBTX), Third Coast Bancshares (TCBX) and NCR Atleos (NATL) in the financials sector, NCR Voyix (VYX) in the IT sector, Macy’s (M) in the consumer discretionary sector and Alaska Air (ALK) in the industrials sector.
Albert Grosman, Managing Director, Portfolio Manager
Brian Lund, CFA, Managing Director, Portfolio Manager
|
Footnote 1 We always take stock-based compensation into account when evaluating a company. Past performance is no guarantee of future results. Copyright © 2024 ClearBridge Investments. All opinions and data included in this commentary are as of the publication date and are subject to change. The opinions and views expressed herein are of the author and may differ from other portfolio managers or the firm as a whole, and are not intended to be a forecast of future events, a guarantee of future results or investment advice. This information should not be used as the sole basis to make any investment decision. The statistics have been obtained from sources believed to be reliable, but the accuracy and completeness of this information cannot be guaranteed. Neither ClearBridge Investments, LLC nor its information providers are responsible for any damages or losses arising from any use of this information. Performance source: Internal. Benchmark source: Russell Investments. Frank Russell Company (“Russell”) is the source and owner of the trademarks, service marks and copyrights related to the Russell Indexes. Russell® is a trademark of Frank Russell Company. Neither Russell nor its licensors accept any liability for any errors or omissions in the Russell Indexes and/or Russell ratings or underlying data and no party may rely on any Russell Indexes and/or Russell ratings and/or underlying data contained in this communication. No further distribution of Russell Data is permitted without Russell’s express written consent. Russell does not promote, sponsor or endorse the content of this communication. |
Original Post
Editor’s Note: This article discusses one or more securities that do not trade on a major U.S. exchange. Please be aware of the risks associated with these stocks.
Read the full article here
")


")
