


")
")
")
Useful Screeners and Capping
The Invesco India ETF (NYSEARCA:PIN) is a 16-year-old product, which focuses on Indian stocks (including ADRs and GDRs) that are believed to score high on certain quality metrics. Besides quality, these stocks are also perceived to score quite decently on the yield front.
To get to its final portfolio of stocks (currently 189 stocks, the bulk of which are Indian large-caps, as they account for close to two-thirds of this portfolio), PIN’s tracking index, which is the FTSE India Quality And Yield Select Index, first approaches the broader FTSE India Index (the parent index).
Stocks within the parent index which currently offer no yield are scrapped from further consideration, as well as those who are part of the bottom 10% from a yield perspective.
These stocks are then put through a quality lens, which is essentially the average of two key parameters- profitability and leverage.
The profitability quotient, is, in turn, a function of three separate metrics, namely the ROA, the asset turnover ratio, and the accruals ratio (which typically serves as a leading indicator of lower levels of profitability. Meanwhile, the degree by which operating cash flow covers total debt serves as the proxy for leverage.
Discerning investors may have noticed that quite a few of the ratios mentioned above (accruals, OCF to debt coverage, asset turnover) would appear to be superfluous or redundant whilst picking out financial stocks; PIN acknowledges this facet and only uses the ROA metric when gauging the quality score of financial stocks.
We also feel the screening could have been enhanced by a time series adjustment or an average figure over time rather than resorting to static measures that may have just been bumped up on account of exceptional circumstances that are unlikely to be repeated.
Thus, whilst the screening is not perfect, it is still a passable way to procure quality Indian stocks, and based on the average profitability and leverage scores we get a total quality score.
PIN also does well to cap its individual holdings at 10% which can help reduce concentration effects in what is essentially a high-beta terrain that could be susceptible to capricious foreign fund flows.
How Does PIN Compare To The Most Popular Indian ETF?
We respect PIN’s strategy to put in place certain screeners to pick out stocks, rather than employing a plain vanilla market-cap-based strategy. However, does this make a big difference in the grand scheme of things?
As a benchmark, we’ve measured PIN’s qualities versus the largest Indian ETF around – the iShares MSCI India ETF (INDA).
Note that INDA made its debut as a public instrument around 4 years after PIN, but yet still it has been able to accumulate a far greater chunk of AUM. INDA currently has AUM within the double-digit billion threshold, yet PIN with its longer history has not even managed $0.3bn of AUM.
As a structure, INDA offers a few benefits. Firstly, from a cost angle, it offers an expense ratio that is 13bps lower than PIN. It also covers a slightly smaller pool of stocks (155 vs. 189 for PIN), which doesn’t necessarily have to be a good or bad thing, but its portfolio is also a lot more stable on an annual basis and isn’t susceptible to frequent churning. For context, INDA’s annual turnover ratio of only 18% is almost only half as much as PIN’s corresponding figure.
The image below suggests that from an income perspective, these are ETFs that are unlikely to whet your appetite, but one can’t help but feel disappointed that PIN doesn’t offer a more compelling yield, as the yield screener is one of the key metrics that it employs when building its portfolio.
YCharts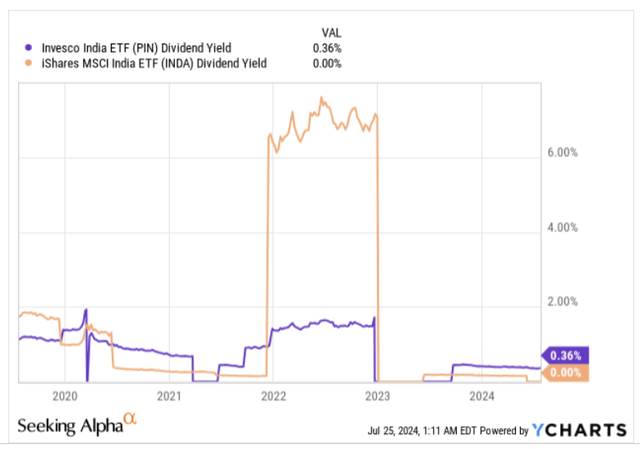
PIN may not necessarily have the most compelling structure, but when it comes to gauging returns or the risk-adjusted return profiles, it does pretty well.
YCharts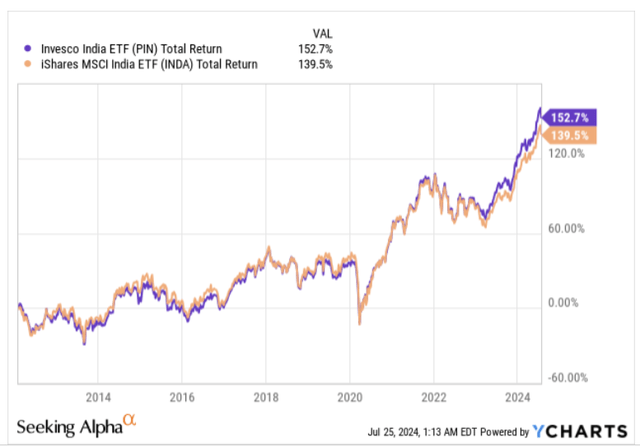
Firstly, note that since INDA made its debut, PIN has managed to outperform its larger peers by 1.1x. However as noted in the image below, it is also the riskier product, of the two, with a higher rolling volatility profile of around 160bps.
YCharts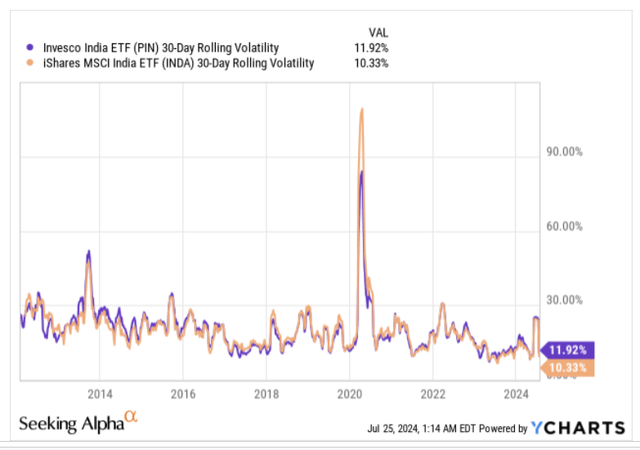
Typically a higher volatility profile serves as a hindrance in scoring good risk-adjusted returns, but note that both PIN’s long-term and short-term Sharpe ratios suggest that it has done a better job of justifying the risk it takes, than INDA
YCharts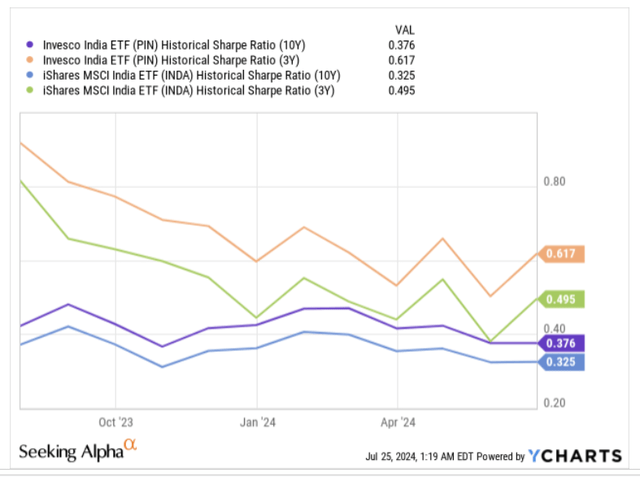
The Sharpe ratio looks at risk-adjusted returns through the lens of standard deviation, whereas the Sortino ratio looks at things through just downside deviation. Even here we can see that PIN topples INDA be it on a 3-year basis or a 10-year basis.
YCharts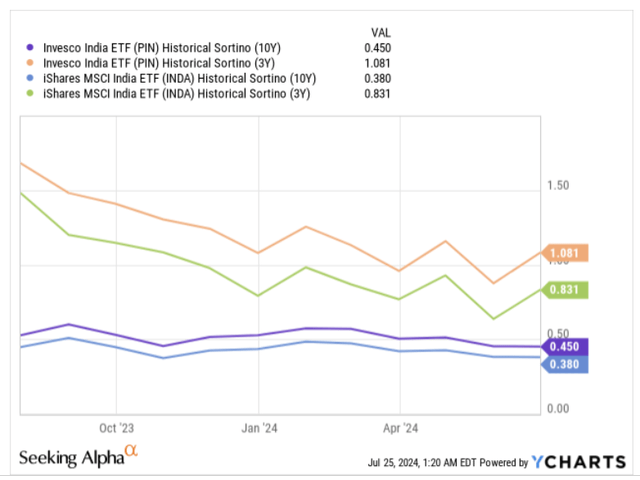
Closing Thoughts – Is PIN A Good Buy Now?
As implied in the previous section, we have a mixed perspective on PIN; whilst it does a good job of juggling its relatively higher risk profile than INDA, as a structure it does suffer from flaws.
Now if you’re still interested in pursuing this product, here are a few things to note.
PIN’s top sector exposure is towards Indian financial stocks, and whilst they will play an integral role in financing the Indian growth story (as per the IMF’s July update, the Indian economy will serve as the fastest-growing major economy for yet another year with expected real GDP growth of 7%, which is around 2.2x the real GDP growth of the globe), investors may be well-advised to not get too carried away, as the degree of loan growth is currently not being adequately financed by deposit mobilisation.
The credit-deposit ratio of Indian banks recently hit two-decade highs (currently deposits are only growing at 10.6% p.a., whereas credit is growing at 14% p.a.), and given this scenario, we could see the central bank urge Indian banks to slow down their lending to certain lucrative sectors in order to avoid a liquidity crunch. S&P Global has already suggested that loan growth for Indian banks will likely slow from the 16% levels to 14% this year.
Besides that, the Indian growth story also needs to see a pickup in private investment and consumption, as in recent periods, much of the momentum has been driven by public CAPEX. Note that private investment levels in Q1-25 (India follows a March year-ending calendar) recently dropped to its lowest point in nearly two decades and that scenario is certainly not ideal when the Indian Finance Minister recently reiterated her desire to follow fiscal consolidation in the years ahead. Put another way, public CAPEX is unlikely to be resilient going forward, as the government plans to bring down the fiscal deficit to GDP ratio from 5.1% last year to 4.9% this year and 4.5% in the following year.
In the short term, the Indian markets could also witness some pressure from developments in the recent Indian budget which pointed to a hike in both the STCG (Short-term Capital Gains Tax) and LTCG (Long-term Capital Gains Tax) by 5% and 2.5% respectively.
Selling could be compounded by the fact that Indian stocks don’t necessarily look cheap. For instance, PIN’s holdings are currently priced at a P/E of 20.4x, whereas a diversified basket of emerging market stocks can be picked up at a discount of 36%. It also doesn’t help that Indian stocks currently look like one of the more overbought counters in the emerging markets universe, with the current RS (relative strength) ratio, not far from hitting record highs, and around 32% higher than its long-term average.
YCharts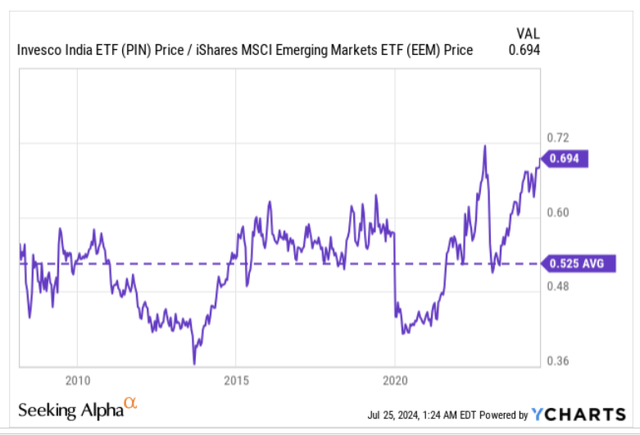
Finally also consider the recent developments on PIN’s standalone monthly chart which only reiterate the overbought thesis. PIN has chopped around within a certain range across its lifetime, and this range has been marked by the two black lines. Currently, the price is perched at the upper boundary, and we also have a scenario where it looks like we could see a red shooting star candle just around the upper Bollinger band (which is 2 standard deviations from the 20-period moving average). Supplementing all this, we also have the default RSI indicator which has now hit overbought levels from where we’ve previously witnessed price reversals.
Investing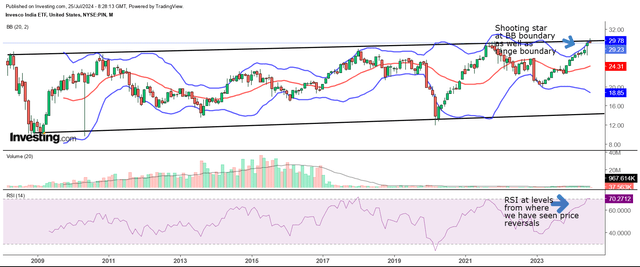
Considering all these facets, we don’t believe PIN would make a good BUY now and would prefer to go with a HOLD rating
Read the full article here


")
")

