")
")
")
 (NYSE:BABA)")

")
The S&P500 (SP500) made an intraday high on July 16th at 5716, based on September 2024 futures (SPX), and it’s currently just under 3% below that level.
Is this just a random dip, or the beginning of a deeper correction? For most investors, it really doesn’t matter, as long as the bull market eventually resumes.
What matters the most for longer-term investors is whether the current 3% dip could be the beginning of a prolonged and deep bear market, like in 2000 or 2008.
Most investors, and particularly the investors near retirement, cannot afford to hold stocks through the 30-50%+ bear market. Thus, the question is whether the bull market peak has been reached, and it’s all downhill from here.
First, technicals
The first thing to look at is the chart. The S&P500 futures dipped below the key short term technical support at 20dma on 7/19, only to close above the 20dma on July 23. Currently, the S&P500 futures are below the 20dma again, near the previous low point.
Thus, currently we have what looks like a double bottom just below the key short term 20dma level. Technically, a close above the 20dma would confirm the recent pullback could be just a 3 dip.
On the other hand, if the S&P500 fails to break the 20dma resistance, the next level to watch is the 50dma support, which would make the current pullback a 4-5% dip. It’s important to note that the 50dma support held during the late May dip.
However, the April pullback in S&P500 reached and held the 100dma support, and if the same support holds this time, the total dip would be just under 6%. Obviously, a 5-6% dip down to 100dma would not matter to most investors – unless the 100dma fails to hold, which would bring the S&P500 down to the 200dma level, for a total drawdown of 10-11% and cause some problems for overleveraged traders.
The real problems would start if the 200dma support fails to hold – this would indicate that the S&P500 is due for a much deeper correction. Here is the daily chart of the S&P500 futures. We are currently just below the first support 20dma (yellow line).
Barchart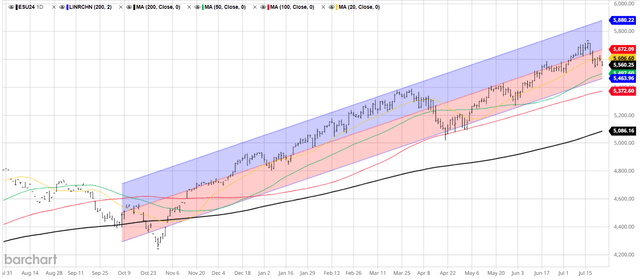
Here is the 5-Year chart of the S&P500 futures. If the 200dma support from the daily chart above fails to hold, the S&P500 is likely headed to the key long-term support at 200wma support (that’s weekly moving average) at around 4300 level, which would make the current drawdown around -25% from the top – that would be a bear market.
Barchart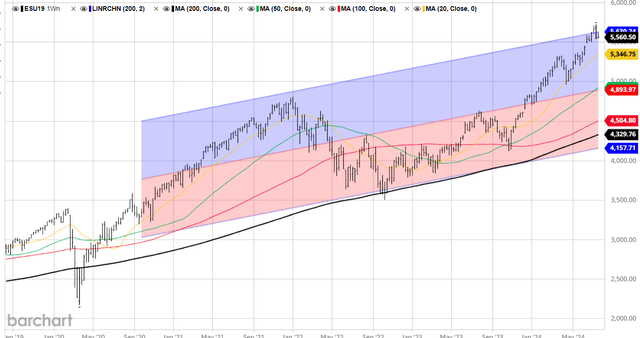
Note, the 200wma held during the 2022 bear market and even during the 2020 covid selloff. The sustained breach below the 200wma would indicate an even deeper bear market, like in 2000 and 2008.
Thus, technically, we are just below the first support level, and technically, it is just a minor dip. The next level to watch is the 50dma support.
Technically, the strategy is to buy the dip above the 20dma, and to continue to buy the melt up, or to wait for the 50dma support to buy the dip. Alternatively, the strategy could be to wait for the 200dma to buy the deeper dip.
The trend change is below the 200dma, at which point, the strategy is to short the S&P500, short the 200dma breakdown.
Fundamentals
Technically, we are still in the bull market, and we are facing the buy the dip situation. However, fundamentally, the S&P500 is a bubble, which could actually be bursting.
First, we have been facing the inverted yield curve for the longest period ever, and it’s logical to assume that the recession is coming – and with it a recessionary bear market.
The recent economic data is supporting the thesis that there is an imminent recession. The most reliable recessionary economic indicator is high-frequency data on initial claims for unemployment, together with the continuous claims for unemployment. Both of these indicators are more than 20% above the cyclically low point, which has traditionally been associated with a recession.
The labor market is weakening, and consumption is likely to slow – that is likely to cause a recession.
Second, the S&P500 is overvalued on all metrics, and the valuation bubble is led by the handful of tech mega-caps under the Gen AI theme. The Gen AI bubble burst could cause a deep -50% drawdown, on par with the 2000 dot-com burst.
Obviously, the Gen AI bubble burst would require a major earnings report miss by one of the tech mega-caps.
Alphabet (GOOG) (GOOGL) is the first Gen AI related mega cap to report earnings, and it beat on revenues and earnings. Yet, the stock price is down by 3% in the pre-market trading. This indicates that investors are concerned about valuation, and possibly irrational growth expectations for Gen AI.
Note, the current dip started with the rotation from these tech mega-caps into small-caps. The continuation of this trend could continue to push the S&P500 lower; however, there is still no evidence of the bubble burst, given the Alphabet earnings report.
Overall, the combination of bubble-like valuations and a possible imminent recession suggests that the current dip could be the beginning of a bear market.
Implications
Technically, the S&P500 is in the minor dip territory. What happens next depends on the fundamentals.
Alphabet earnings don’t give us evidence of the bubble burst yet. We will have to wait for the Nvidia (NVDA) earnings in late August to get confirmation whether we are in the process of Gen AI bubble burst. The Nvidia miss on revenue/earnings and/or guidance would burst the bubble. The S&P500 is likely to remain in the 5-10% dip territory until Nvidia earnings.
In addition, the economic data will be important. If the disinflationary trend continues, while the labor market does not weaken further, the Fed could cut in September and this could provide some support to value stocks.
My opinion continues to be that we are near a recession and that the Gen AI bubble is bursting, but both of these theses require more evidence.
Read the full article here
")
")
")
 (NYSE:BABA)")

