")


How is it Getty images has hundreds of thousands of images and zero hits for “snark dog”?
Time for another run down on the mortgage REITs. We’re going with one of my favorite layouts.
I call this one:
Turn music on and mash on the keyboard until money comes out.
In other words, I’m sharing a few random observations.
Ready Capital
First thing that stands out. I’m surprised Ready Capital (RC) has underperformed so much over the last couple years. I know I’ve brought this up a few times, but I’m still surprised by the weak performance.
To be clear, Ready Capital hasn’t done great on fundamentals. They’ve seen the value of assets decline, and they have some loans that aren’t performing. As management referenced previously, they marked down a bunch of those loans to reflect sale value. These were assets that could be held at historical amortized cost adjusted for any impairments.
The majority of mortgage REITs assets are subject to mark-to-market rules. However, there are some loans that flow outside that category. They still adjust for expected losses, but it isn’t as consistent as the mark-to-market we see on positions in agency MBS. It seems like investors are less confident in RC’s book value after the write-down. On the other hand, I’m more confident. They took the hit on the worst assets. But investors are writing them off as if they will record several more quarters of significant write-downs.
These less desirable loans should have substantial overlap with the loans that had a risk rating of 4 or 5 and the loans that were on non-accrual status. Non-accrual status is horrible for earnings metrics because the REIT isn’t recording interest income ($0 of interest income). They still have interest expenses from financing, but they don’t get the revenue. Consequently, non-accrual loans lead to negative net interest income.
There’s nothing wrong with working out these assets, but the current performance is a big drag on reported performance.
The buyback program also looks great. The REIT repurchased 2.1 million shares in Q1 at $8.88 and 1.6 million more shares in early Q2 at $8.57. That’s over 2% of the shares outstanding!
I like to see RC using capital that way. It’s very accretive to book value and earnings because the REIT trades at a low ratio of BV and low multiple of earnings.
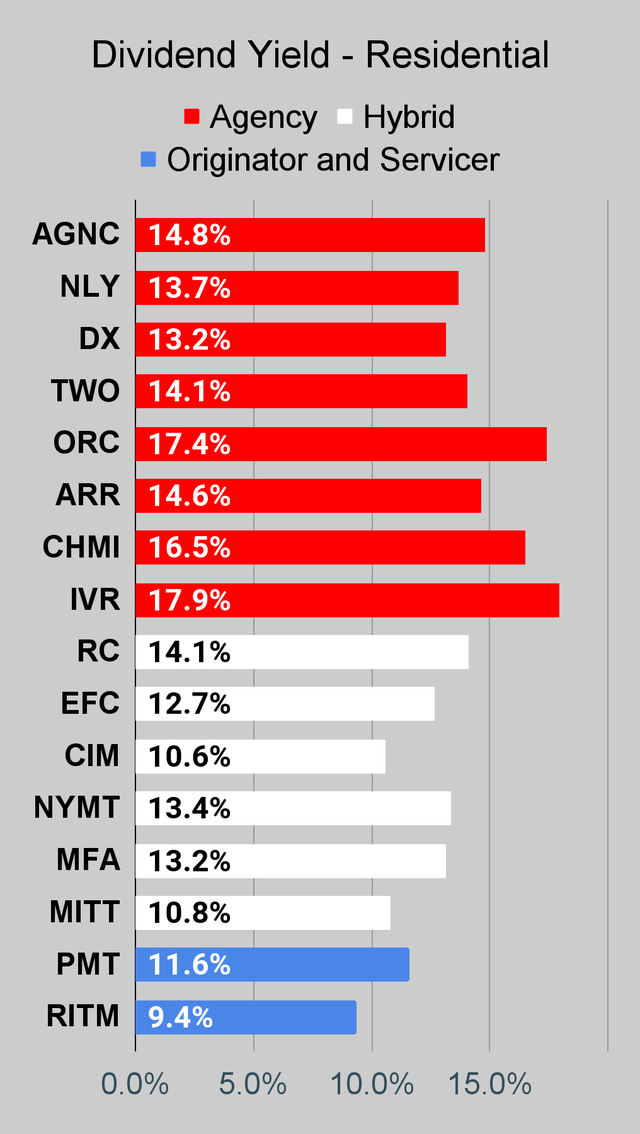
RC has a dividend yield of 14.1%. It’s relatively rare for me to find something so far into double digits where I think the stock is attractive. While a 14.1% dividend yield is very high, it’s only 9.2% on book value. That means management actually has a respectable amount of book value to invest. Earning 9.2% on book value isn’t crazy, especially given the high short-term rates present today.
Agency Mortgage REIT Insanity
Do you like agency mortgage REITs?
You just categorized yourself into one of a few groups:
- People who don’t like them.
- People who like them.
- People who say, “it depends on the valuation.”
- People who don’t know what agency mortgage REIT means.
Welcome to all of you.
If you like agency mortgage REITs, you should like them at substantial discounts to book value.
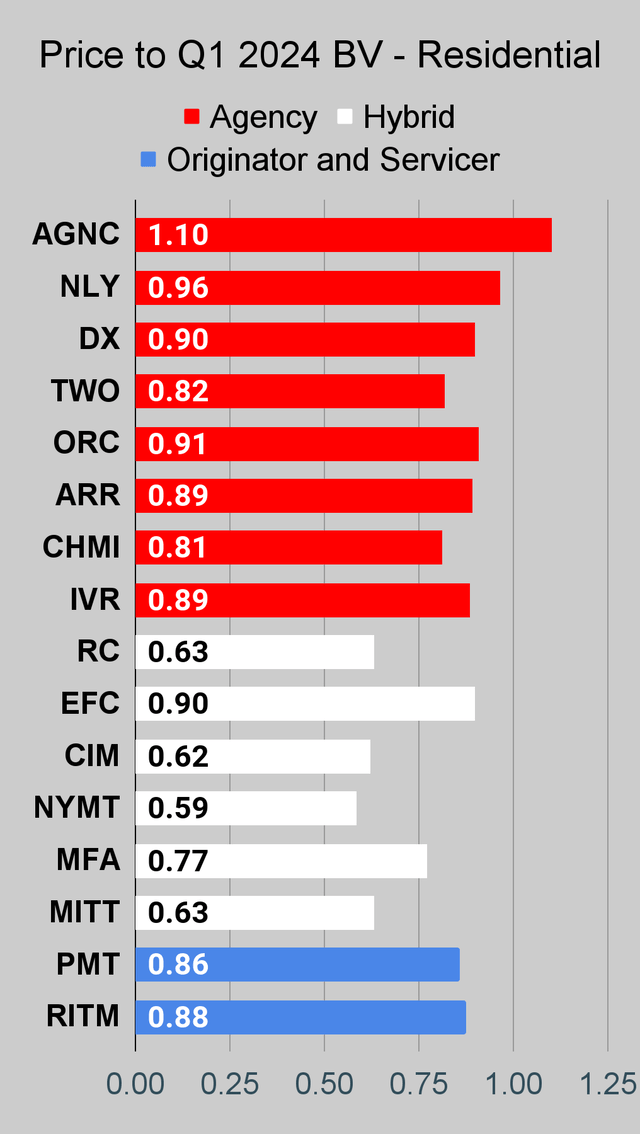
This is where things get strange. AGNC Investment (AGNC) trades around 1.14x book value (using our estimates).
That is extremely high. The best thing AGNC can do for long-term shareholders is pump out equity at that insane premium.
If I were AGNC, I would want to pre-release earnings to end the blackout period and resume issuing shares. This is an opportunity to enhance long-term returns by selling shares to people who don’t understand mortgage REITs. I absolutely do not like AGNC around 1.14x book value. That’s a horrible deal.
Then we have Dynex Capital (DX). DX trades around 95% of book value. The assets and hedges owned by DX have a substantial overlap with AGNC. We’re projecting a dip in book value for both REITs during Q2 2024. We’re also projecting that the dip for DX will be slightly bigger. However, it’s not a huge gap and the change in BVs is already factored into the values I just provided.
Investors don’t like DX currently because their “earnings” look like trash. Why? Historical amortized cost accounting for yields holds down the yield on assets. Meanwhile, the hedge structure flows through “realized gains and losses on derivatives” rather than “net interest income.” That combination leads to DX reporting lower income and higher interest expense. It’s an accounting impact.
An accounting impact that is currently driving a gap of about .20x in price-to-book ratios. Anyone want to tell me about how efficient markets are today?
You want to blame it on the difference in dividends? AGNC has a 14.8% yield and DX has a 13.2% yield. That could be impacting market prices, but it’s another slap to the face of efficient markets.
Should they have equal yields?
If you actually believe so, try to say this sentence out loud:
If the board of directors announced a dividend that was 12.1% higher, I would pay 12.1% more for shares. Because my idea of stock research is paying a multiple of whatever number the board of directors announces. That’s why I think Amazon (AMZN) stock is worthless.
Pretty awkward, right?
Now we should move on to Orchid Island Capital (ORC) for another comparison.
There are three major differences:
- Internal management at DX vs external at ORC.
- History of performance is much better for DX.
- Talent.
As you might guess, talent was a factor driving the gap in historical performance.
Here’s a chart worth an entire article:
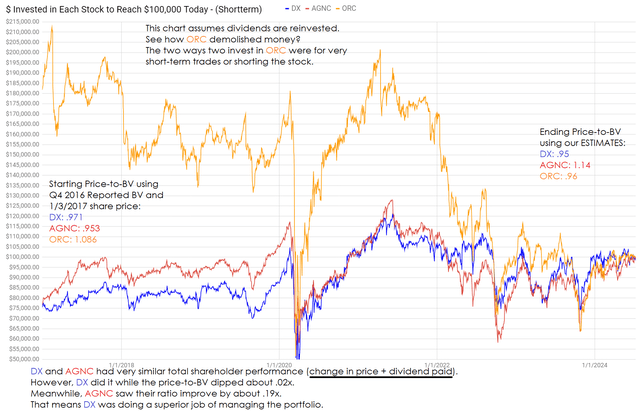
The REIT Forum
During our chart, which runs back to the start of 2017, DX managed their portfolio better than AGNC. They had similar assets, but DX did a bit better. On the other hand, ORC was awful.
Other Notes
I regularly tell investors who want a long-term investment that they are better off using preferred shares. Common shares are for trading.
Want to see an investment that really smoked AGNC?
Try the preferred shares:
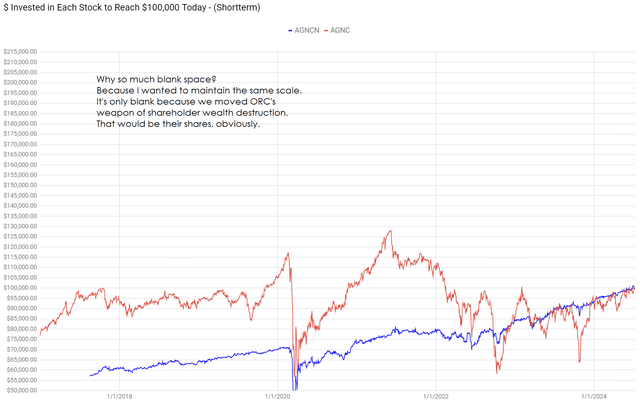
The REIT Forum
AGNC’s common shares have significantly underperformed the preferred share, unless you bought in during one of the sharp dips. But not the pandemic. No, the preferred would still win there. To be clear, the preferred share fell less than the common during the pandemic, but it recovered quickly and was a consistent tool of wealth production.
Further, this chart still includes AGNC ending at a projected 1.14x price-to-book ratio.
If that ratio fell to 1.00x, it would push the entire red line higher. There would be far fewer dips below the blue line.
In other words, the primary reason investors in AGNC are doing so well today is because of the high price-to-book ratio.
AGNCN has a dividend yield slightly over 10%. However, the yield to call is negative because shares trade at a material premium to the call value. So that’s a significant risk. There are alternatives, but this article already rocks.
Opinions On These Shares
Ready Capital looks cheap. I bought more shares recently. Maybe I’m a glutton for punishment? I bought 3 times so far this year.
- 2/7/2024 at $8.83.
- 6/5/2024 at $8.51.
- 7/1/2024 at $8.02
I think AGNC looks too expensive. Investors are overpaying for earnings yield and dividend yield because they don’t know better.
Investors looking for a pair trade may want to consider shorting AGNC and buying DX.
Investors thinking about buying ORC should pick DX instead. Very similar valuation, but it comes with internal management and more talent. Picking ORC because of a higher dividend yield is a sign that the investor should stick to index funds.
Well, that’s probably more keys than I needed to press.
I think I’ll write about these stocks again soon. Perhaps with more snark. Definitely more snark. The best thing about being a snarky author is I don’t have to worry about my reputation. If I say something snarky, no one is surprised. There are no consequences. That’s on-brand for me.
Don’t get me wrong, I do have a reputation to protect. But I do it by getting calls right, not simpering.
Someone once told me snark was unprofessional. I don’t know why they shared that opinion. I didn’t ask them how to be poor or boring.
Just one more note. I’ll be doing an article on Agree Realty (ADC) and I plan to answer a bunch of reader questions.
If you have a question about ADC, reply to this article with it.
Preferred Share Guide
If you’re interested in preferred shares, make sure to check out our huge free guide to preferred shares.
You know it’s great because I wrote it. You know it’s long because it’s over 67 pages. Examples take space.
We could’ve had less examples, but then it wouldn’t be as good.
Many readers have told me it’s their primary resource for learning how preferred shares work.
It took a few years to bring it all together, so I hope readers enjoy it.
Stock Table
We will close out the rest of the article with the tables and charts we provide for readers to help them track the sector for both common shares and preferred shares.
We’re including a quick table for the common shares that will be shown in our tables:
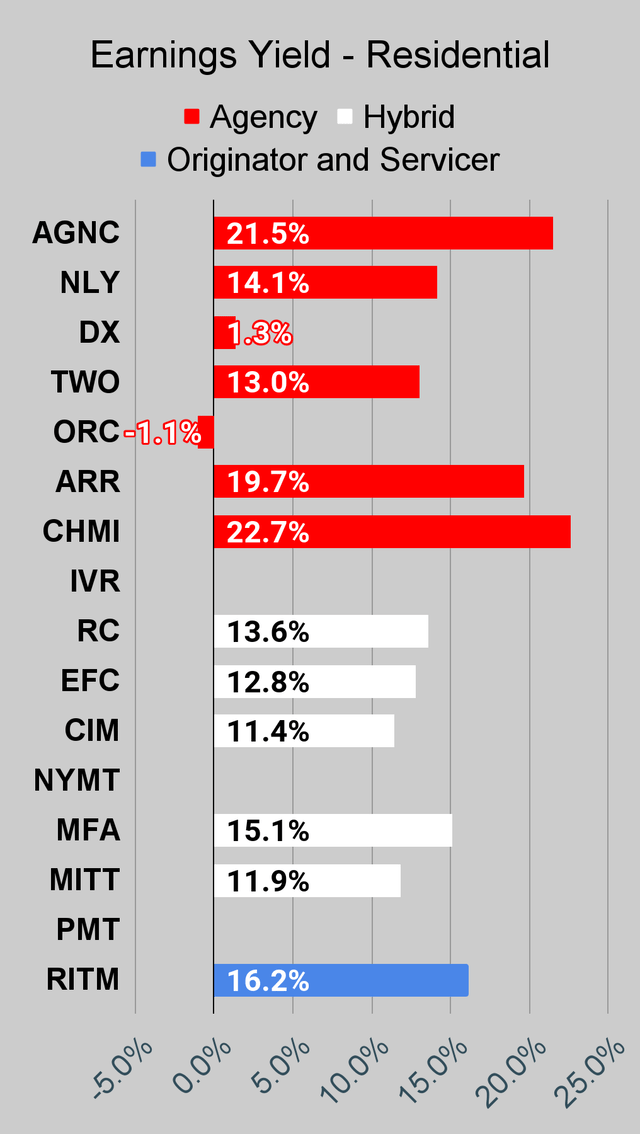
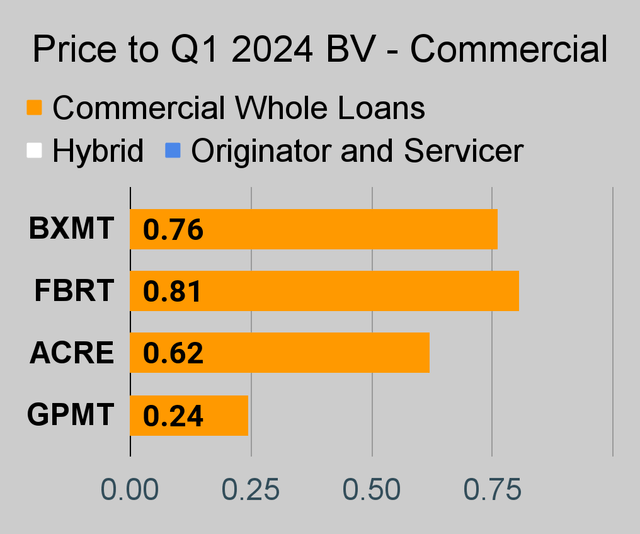
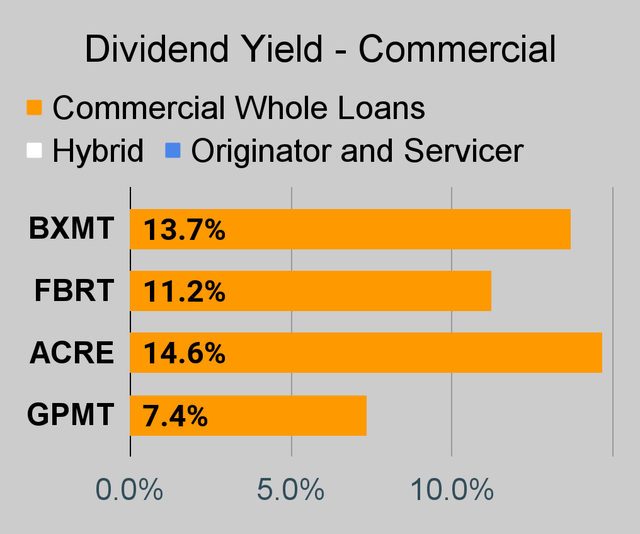
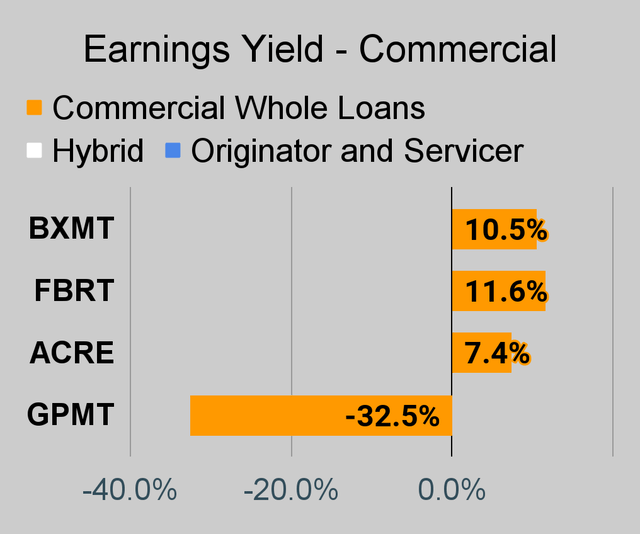
If you’re looking for a stock that I haven’t mentioned yet, you’ll still find it in the charts below. The charts contain comparisons based on price-to-book value, dividend yields, and earnings yield. You won’t find these tables anywhere else.
For mortgage REITs, please look at the charts for AGNC, NLY, DX, ORC, ARR, CHMI, TWO, IVR, CIM, EFC, NYMT, MFA, MITT, AAIC, PMT, RITM, BXMT, GPMT, WMC, and RC.
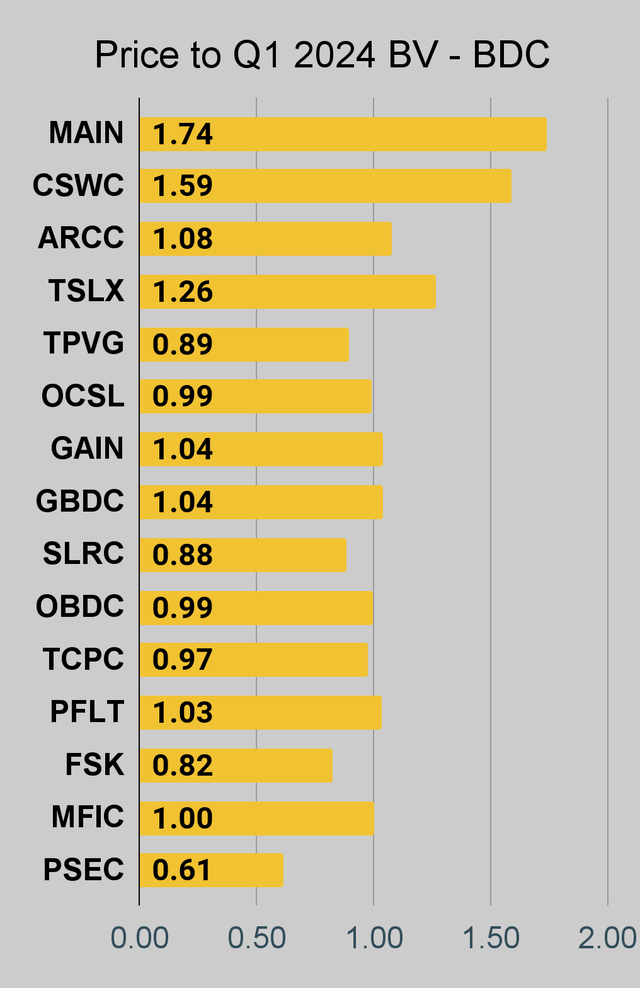
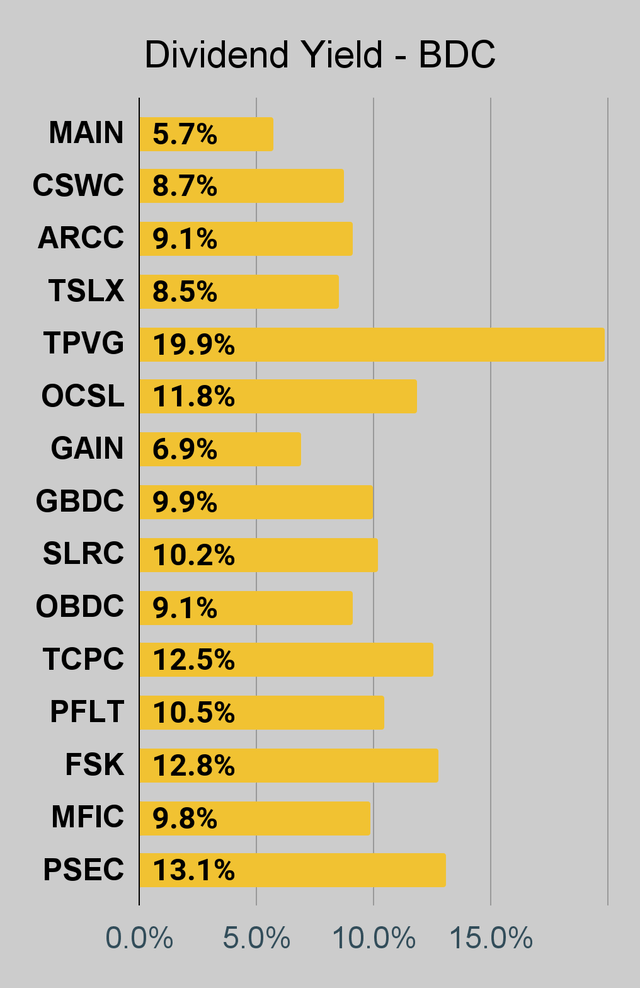
For BDCs, please look at the charts for MAIN, CSWC, ARCC, TSLX, TPVG, OCSL, GAIN, GBDC, SLRC, OBDC, PFLT, TCPC, FSK, PSEC, and MFIC.
This series is the easiest place to find charts providing up-to-date comparisons across the sector.
Notes on Chart Sorting
Within each type of security, the sorting is usually based on risk ratings. However, it is quite common to have a few shares that are tied. When the shares are tied for risk rating, the sorting becomes arbitrary. There may occasionally be errors where a share’s position is not updated quickly following a change in the risk rating. That can happen because the charts come from a separate system. When I update the system we use for members, it doesn’t change the order in the charts.
When I say, “within each type of security,” I’m referencing categories such as “agency mortgage REITs.” The “hybrid mortgage REITs” are all listed after the “agency mortgage REITs.” However, that does not mean RC (lowest hybrid) has a higher risk rating than the highest agency mortgage REIT. Each batch is presented by themselves.
PMT and RITM are tied for risk rating.
This could probably be written better. If someone feels inclined to take it upon themselves to write a section that is objectively better at communicating these points, I would be interested in using it. I’m grateful to have the best readers on SA. I attribute this to self-selection bias. I include enough things to offend the dumb people that I’m left with the best readers.
Note: The chart for our public articles uses the book value per share from the quarter indicated in the chart. We use the current estimated (proprietary estimates) book value per share to determine our targets and trading decisions. It is available in our service, but those estimates are not included in the charts below. PMT and NYMT are not showing an earnings yield metric as neither REIT provides a quarterly “Core EPS” metric. Presently, a few other REITs also have no consensus estimate.
Second Note: Due to the way historical amortized cost and hedging is factored into the earnings metrics, it is possible for two mortgage REITs with similar portfolios to post materially different metrics for earnings. I would be very cautious about putting much emphasis on the consensus analyst estimate (which is used to determine the earnings yield). In particular, throughout late 2022 the earnings metric became less comparable for many REITs.
Residential Mortgage REIT Charts
 The REIT Forum |
 The REIT Forum |
 The REIT Forum |
Commercial Mortgage REIT Charts
 The REIT Forum |
 The REIT Forum |
 The REIT Forum |
BDC Charts
 The REIT Forum |
 The REIT Forum |
 The REIT Forum |
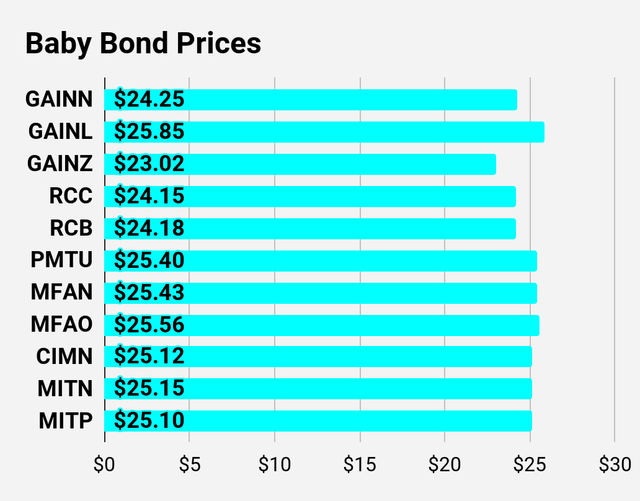
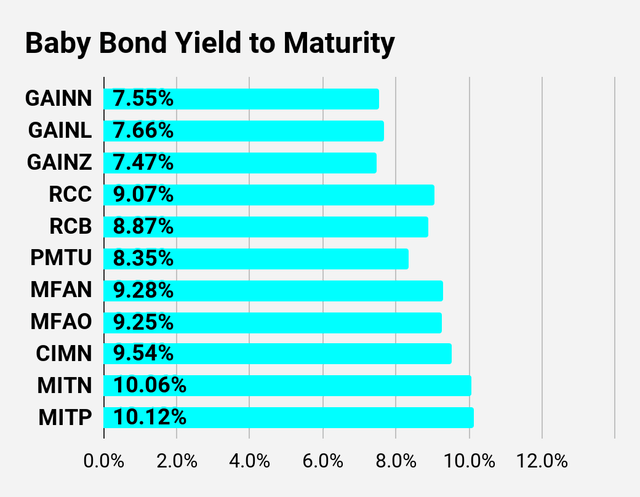
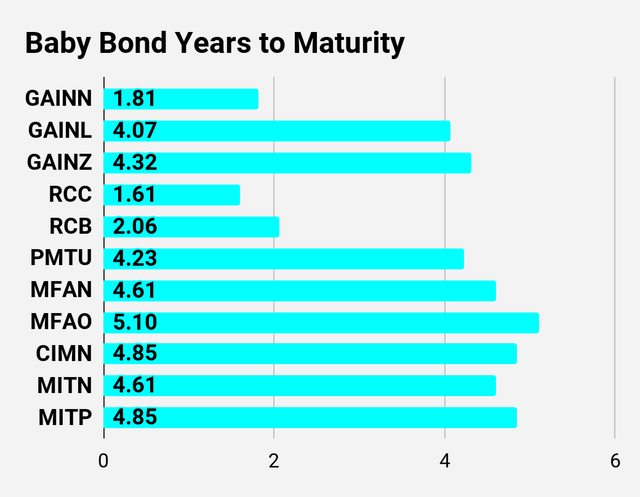
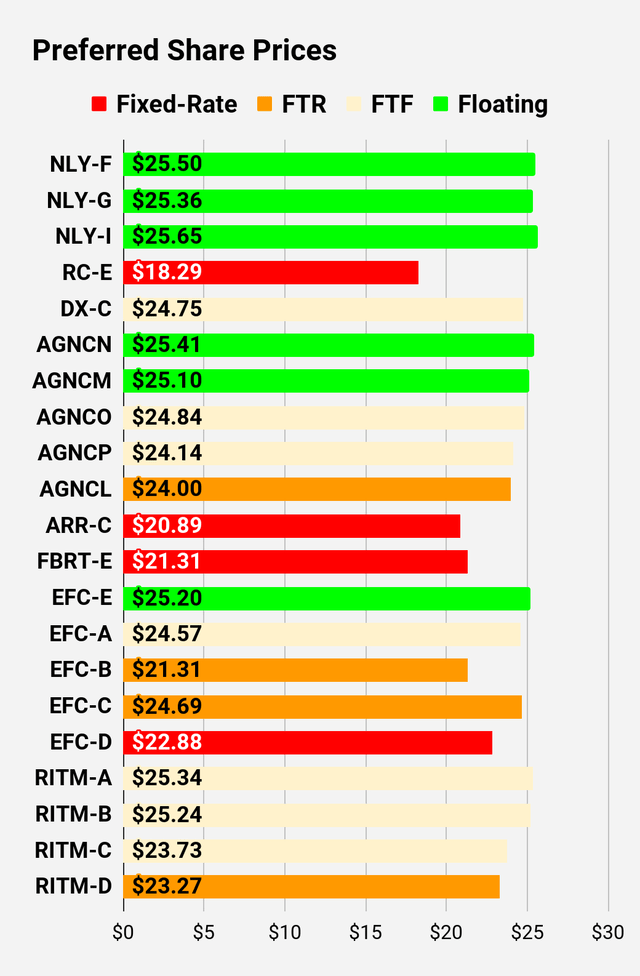
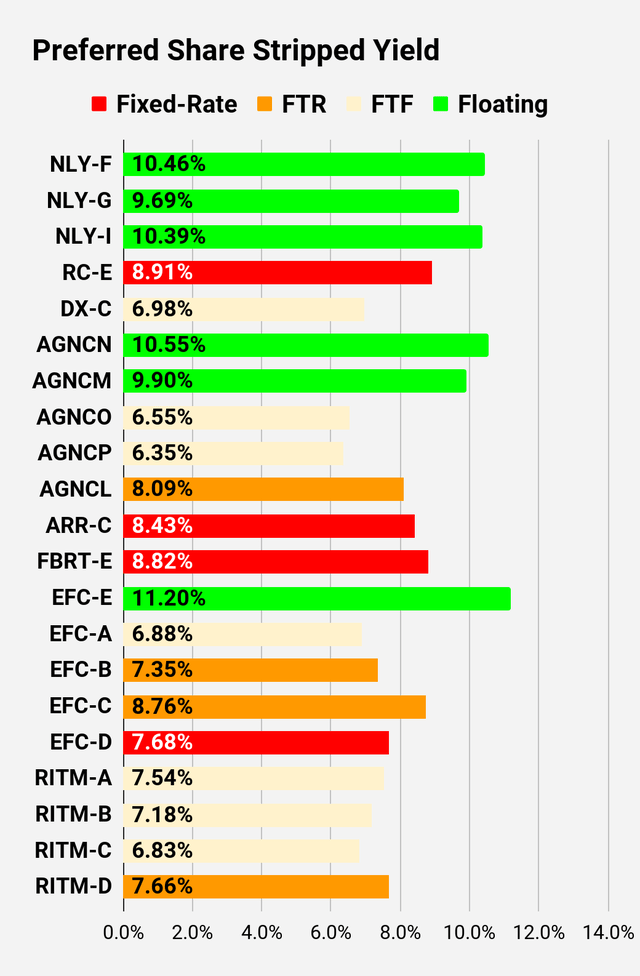
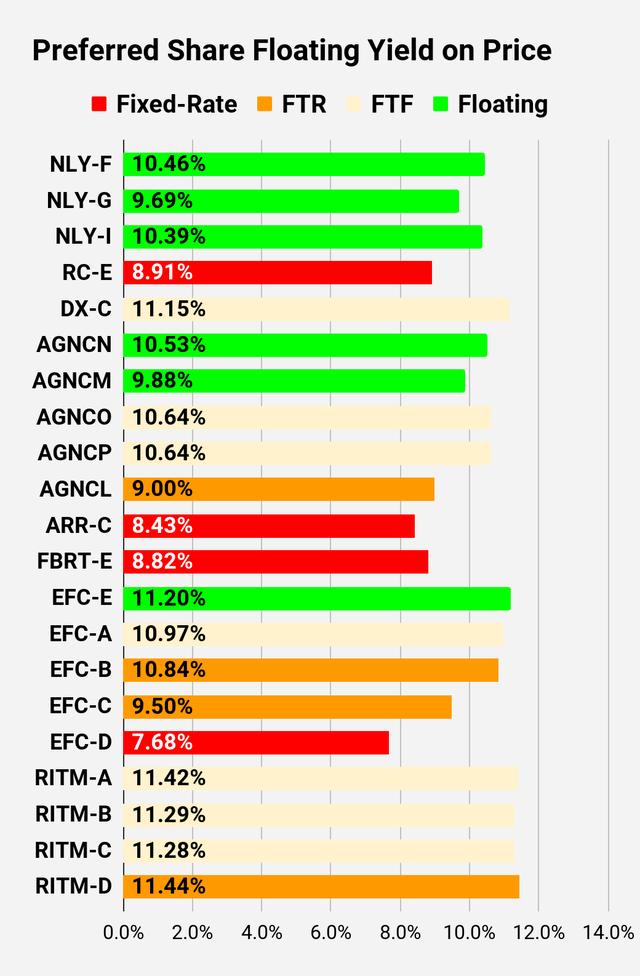
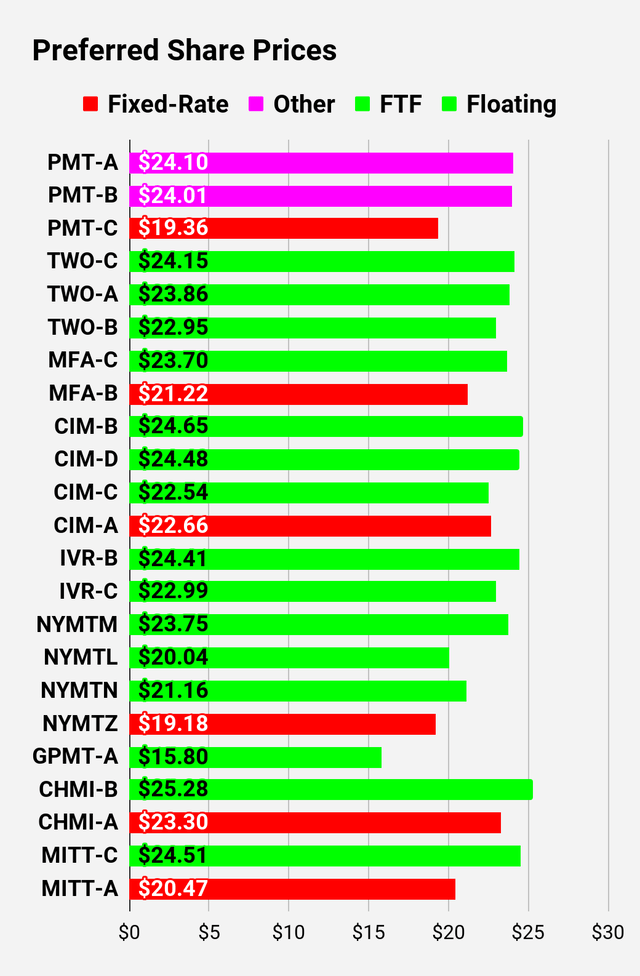
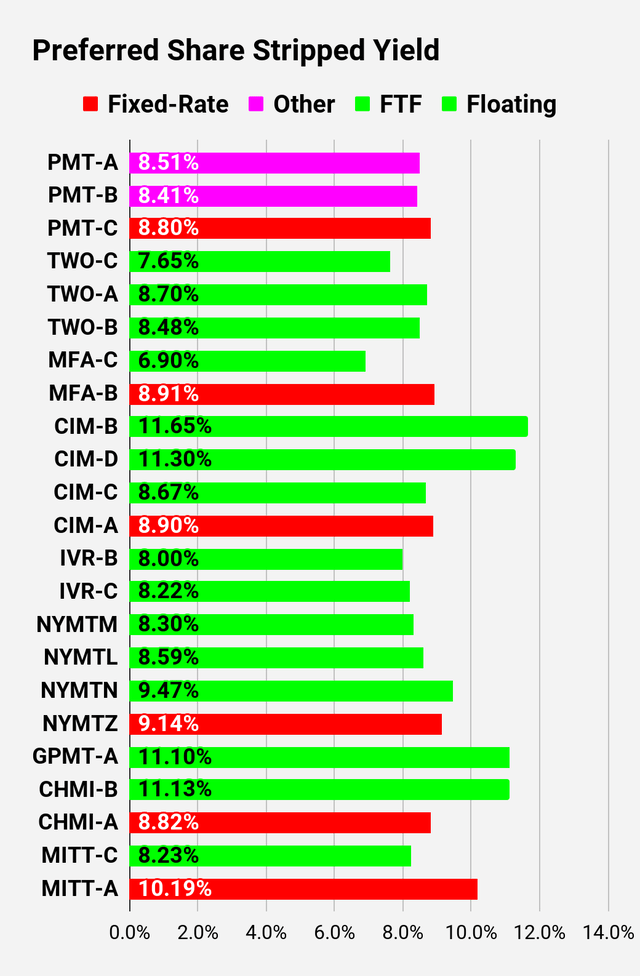
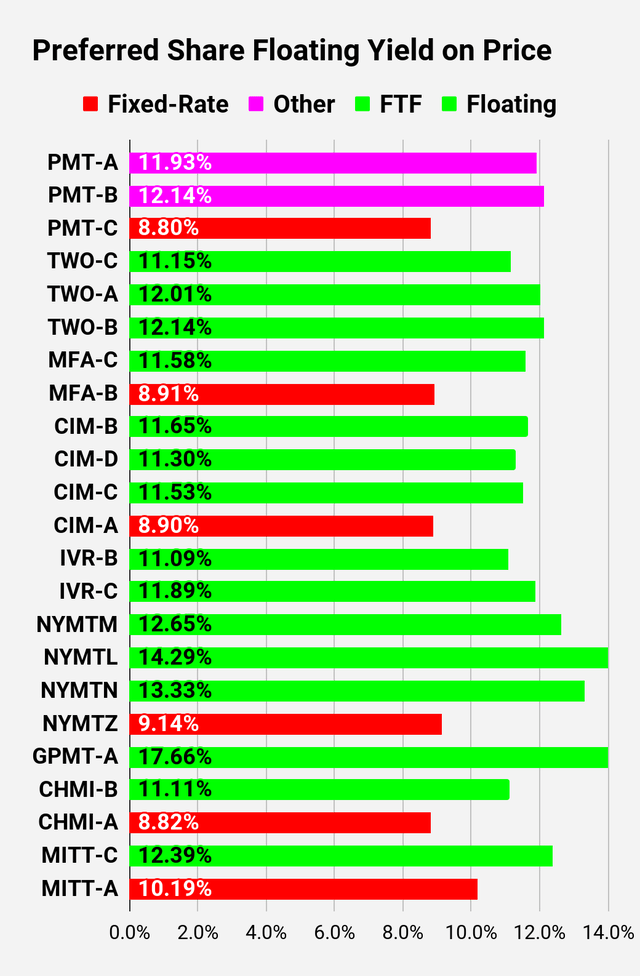
Preferred Share and Baby Bond Charts
I changed the coloring a bit. We needed to adjust to include that the first fixed-to-floating shares have transitioned over to floating rates. When a share is already floating, the stripped yield may be different from the “Floating Yield on Price” due to changes in interest rates. For instance, NLY-F already has a floating rate. However, the rate is only reset once per 3 months. The stripped yield is calculated using the upcoming projected dividend payment and the “Floating Yield on Price” is based on where the dividend would be if the rate reset today. In my opinion, for these shares the “Floating Yield on Price” is clearly the more important metric.
 The REIT Forum |
 The REIT Forum |
 The REIT Forum |
 The REIT Forum |
 The REIT Forum |
 The REIT Forum |
 The REIT Forum |
 The REIT Forum |
 The REIT Forum |
Note: Shares that are classified as “Other” are not necessarily the same. Within The REIT Forum, we provide further distinction. For the purpose of these charts, I lumped all of them together as “Other.” Now there are only two left, PMT-A and PMT-B. Those both have the same issue. Management claims the shares will be fixed-rate, even though the prospectus says they should be fixed-to-floating.
Preferred Share Data
Beyond the charts, we’re also providing our readers with access to several other metrics for the preferred shares.
After testing out a series on preferred shares, we decided to try merging it into the series on common shares. After all, we are still talking about positions in mortgage REITs. We don’t have any desire to cover preferred shares without cumulative dividends, so any preferred shares you see in our column will have cumulative dividends. You can verify that by using Quantum Online. We’ve included the links in the table below.
To better organize the table, we needed to abbreviate column names as follows:
- Price = Recent Share Price – Shown in Charts
- S-Yield = Stripped Yield – Shown in Charts
- Coupon = Initial Fixed-Rate Coupon
- FYoP = Floating Yield on Price – Shown in Charts
- NCD = Next Call Date (the soonest shares could be called)
- Note: For all FTF issues, the floating rate would start on NCD.
- WCC = Worst Cash to Call (lowest net cash return possible from a call)
- QO Link = Link to Quantum Online Page
Second batch:
Third batch:
Strategy
Our goal is to maximize total returns. We achieve those most effectively by including “trading” strategies. We regularly trade positions in the mortgage REIT common shares and BDCs because:
- Prices are inefficient.
- Long-term, share prices generally revolve around book value.
- Short-term, price-to-book ratios can deviate materially.
- Book value isn’t the only step in analysis, but it is the cornerstone.
We also allocate to preferred shares and equity REITs. We encourage buy-and-hold investors to consider using more preferred shares and equity REITs.
If you would like notifications as to when my new articles are published, please hit the button at the bottom of the page to “Follow” me.
Read the full article here
")
