

 Q2 2024 Earnings Call Transcript")


The June job report wasn’t as robust as in previous months. The non-farm payroll number still came in stronger than expected on the headline, but it showed downward revisions over the past two months, while the private payrolls came in surprisingly low.
The report may leave the Fed vulnerable, especially now that inflation is just high enough to keep the Fed worried and from delaying rate cuts to a point where it may be too late to avoid a recession.
The 4% Barrier
Also, the unemployment rate has broken above a critical level, rising to 4.1%, its highest level since November 2021. The break above the May reading of 4.0% may suggest that something fundamentally is changing in the economy and that the Treasury yield curve may be due to steepening, as the front end of the curve starts to now price in Fed rate cuts, in a signal that the economy is now turning a corner, and not for the better, further reducing the odds of stagflation and increasing the odds of a recession.
Bloomberg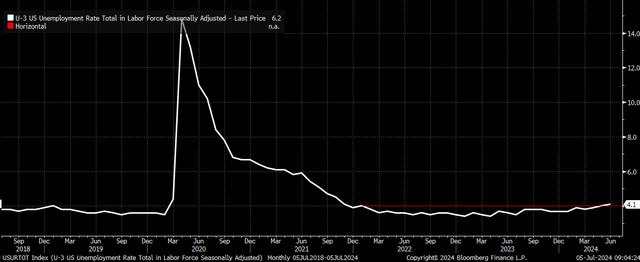
This month, the number of unemployed workers increased by 162,000 to 6.81 million, a 14% increase year over year, matching the level seen in April. Going back to 1960, a 14% increase is a pretty big increase, typically leading to more significant gains.
Bloomberg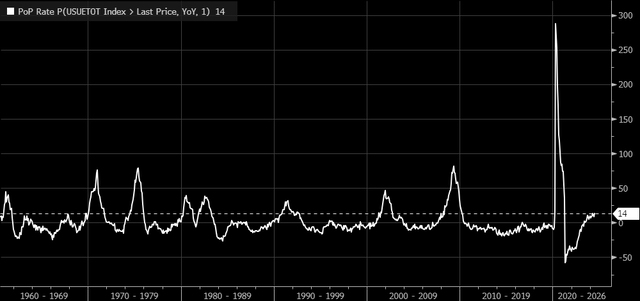
Also, this month saw the SAHM rule move higher to 0.42%, which is now very close to reaching the 0.5% level needed to trigger a recession warning. The rule states that the economy has entered a recession when the unemployment rate rises by 0.5% percentage points on a 3-month average over 12 months.
Bloomberg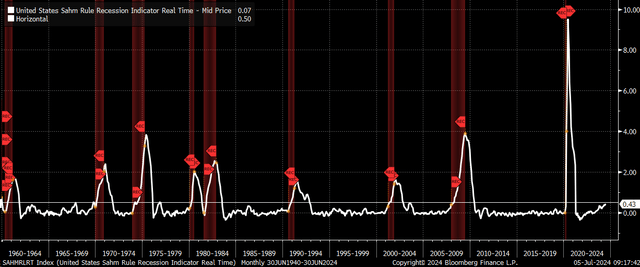
Yield Curve Steepening
Going back to 1979, the yield curve begins to steepen whenever the unemployment rate increases—the widening spread between the 10-year and the 2-year notes this. While the yield curve has already steepened somewhat, with the unemployment rate now trending higher, the curve should start to move higher.
Bloomberg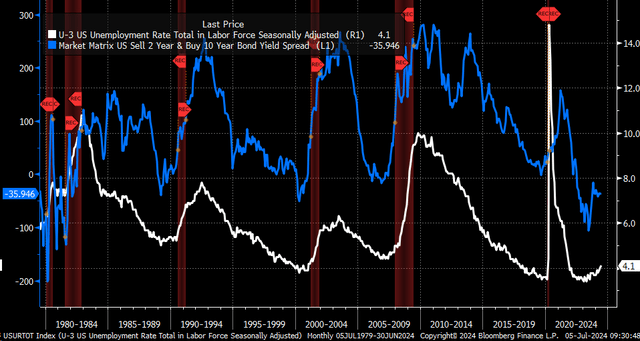
The steepening process can generally lead to a significant and quick move once it begins because typically, the spread tops out around 250 to 300 bps, which means the 2-year Treasury rate falls and, in this case, assuming a starting point near the 2-year rate high of 5.1%, probably means the 10-year rate stays reasonably well anchored. It could suggest that a two rate bottoms somewhere around 2.1%, and the 10-year remains around 4.5%. However, in 1985 and 2021, it peaked at around 150 bps, which would imply a 2-year rate of 3.6% and a 10-year rate of around 4.5 to 5%.
Given how low inverted the curve was, at more than -100 bps, and its typically steepening from trough to peak of around 300 bps, it seems possible that the 2-year rate could fall by around 300 bps to 2.1%, bringing the spread to around 200 bps and the 10-year rate to 4.1%.
Bloomberg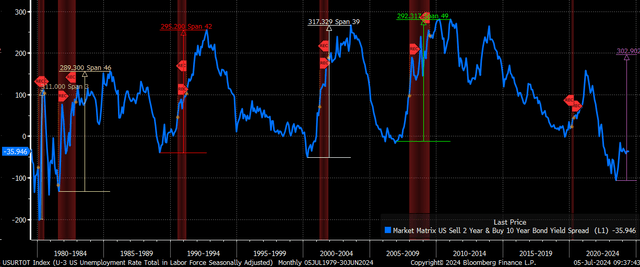
High Yield Spreads
But it is also important to note that when unemployment rates rise, should they continue to rise, high yield spreads also widen, especially when the curve is steepening very quickly, as the market prices in rate cuts due to worries over an economic slowdown.
Bloomberg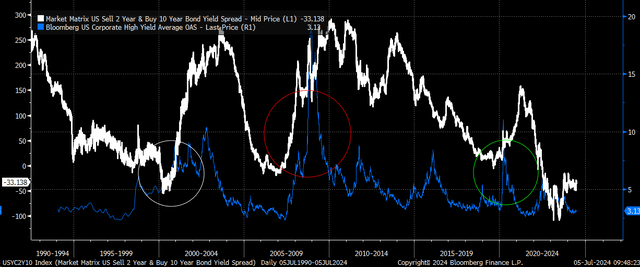
This has already been showing signs of happening during this cycle. Upticks in the 10/2 curve have already led to higher high-yield spreads. If the Treasury curve starts to steepen meaningfully, it seems likely that the high-yield spreads should widen as well.
Bloomberg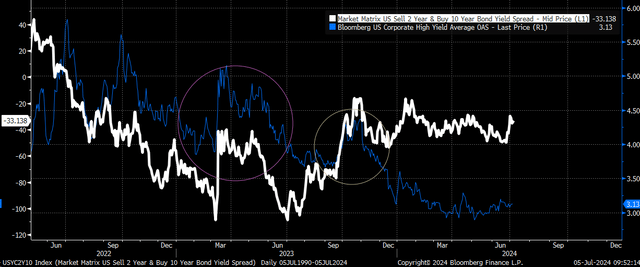
Inflation Just High Enough
The only question that remains is what the wage growth number implies. With GDPNow estimates plunging, it would seem that second-quarter productivity isn’t likely to be all that much higher than in the first quarter. With a 3.9% wage growth number y/y and very little, if any, productivity, it would seem to suggest that inflation is still running in the 3 to 4% range, which is what the June CPI report is expected to show.
Bloomberg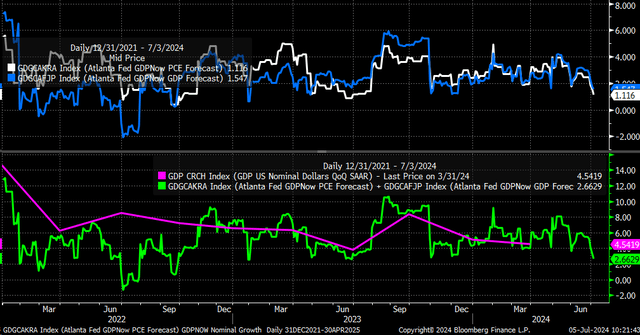
So we have a developing scenario that could mean the Fed is very late to cutting rates because inflation still exists, even at an overall much lower level, but still just enough to keep the Fed acting.
Editor’s Note: This article covers one or more microcap stocks. Please be aware of the risks associated with these stocks.
Read the full article here

 Q2 2024 Earnings Call Transcript")

