


 Stock: The Next Data Center PPA")


|
2023 Annual Letter |
|||||
|
To December 31st 2023: |
LRCP Equity Fund I Gross |
LRCP Equity Fund I Net |
S&P 500 |
Russell 2000 |
MSCI World Index |
|
Trailing 1-yr Total Return: |
36.5% |
28.4% |
26.2% |
16.9% |
23.8% |
|
Trailing 2-yr Total Return: |
53.6% |
41.8% |
3.4% |
-7.1% |
1.8% |
|
Trailing 3-yr Total Return: |
117.7% |
87.7% |
33.0% |
6.7% |
24.6% |
|
Trailing 4-yr Total Return: |
140.8% |
104.5% |
57.4% |
28.1% |
45.1% |
|
Trailing 5-yr Total Return: |
146.9% |
109.7% |
107.1% |
60.6% |
85.8% |
|
Trailing 6-yr Total Return: |
137.4% |
101.7% |
98.0% |
41.1% |
72.9% |
The figures above are on a cumulative basis and are unaudited. Future results will also be presented on a cumulative basis in this section. Annual results will be illustrated below for those who wish to measure us based on 12-month cycles. However, we view the cumulative results as most meaningful since we are trying to build wealth far into the future and the annual results are only important in as much as they contribute to a 3, 5, 10, and 20-year track record.
|
Annual Results: |
LRCP Equity Fund I Gross |
LRCP Equity Fund I Net |
S&P 500 Energy |
AMZ |
XAL |
|
2023: |
36.5% |
28.4% |
-.6% |
26.6% |
28.2% |
|
2022: |
12.5% |
10.3% |
64.2% |
30.5% |
-35.0% |
|
2021: |
41.8% |
32.4% |
53.3% |
39.9% |
-1.7% |
|
2020: |
10.6% |
9.0% |
-33.7% |
-28.8% |
-24.2% |
|
2019: |
2.5% |
2.5% |
11.8% |
6.5% |
21.3% |
|
2018: |
-3.8% |
-3.8% |
-18.1% |
-12.4% |
-22.4% |
To reiterate, our goal is to have good absolute returns first and foremost, which should lead to good relative returns versus the broader markets. However, I also think it’s important to highlight the performance of the primary sectors in which we feel we have an advantage and in which we invest. There is no reason to present this other than for transparency reasons. Owning a highly concentrated portfolio will prevent our results from looking like anything we compare them to in most years, but knowing the performance of energy broadly, midstream energy specifically, and North American airlines will add some context for those partners who wish to do some higher-level analysis. Please see the accompanying disclaimer & footnotes at the end of the letter for a broader description of each of these indices.
Results for 2023
Our partnership returned 36.5% gross and 28.4% net of performance fees in 2023.
The portfolio did not change materially from the start of the year to the end. We still only own 9 positions, with the top 3 comprising just over 50% of the portfolio and the top 5 ~70%. At year-end, we held approximately 14% in cash & equivalents.
Aside from our options activity in Equitrans Midstream (ETRN) that was highlighted in the mid-year letter, the only notable changes over the past 12-months were selling our entire position in Crestwood Equity Partners prior to the closing of its acquisition by Energy Transfer (ET), and a small purchase of preferred shares in a company that shall go unnamed. The unnamed security is very illiquid and therefore quite volatile. It’s not for the faint of heart and God forbid anybody actually read these letters and purchase names we discuss! However, we purchased it at a 50% discount to par and a 28% yield, value that has come and gone. And while not a big enough position to get us into the investing hall of fame if we collect the 28% for a few years and sell it close to par, it will add a few hundred basis points to performance – the kind of opportunity only afforded by the small size of our fund and our narrow lanes of focus.
Due to performance, the estimated dividend and FCF yields of the portfolio have declined to 6% and 14%, respectively, from 7.5% and 16.5% last year. Our portfolio has gotten a touch more expensive, and in response we have become a touch more defensive. Since year-end, the weighting to cash has gone up a little and we’ve harvested some gains in call options; using some of the proceeds to buy longer dated calls at higher strike prices while also allocating a little capital to put options on some of our biggest positions.
Nate and I still like the prospects for our portfolio, especially over the intermediate term, but mathematically a little heat has come out of future returns as valuations compressed, and we wouldn’t be surprised if we had opportunities to put some cash to work in the near future. The late, great Charlie Munger reminded us all that we would be a lot happier if we just lowered our expectations. After nearly doubling our investors’ money in 3-years we’ve slightly lowered ours.
Vistra Corp. (VST) + Energy Harbor (OTC:ENGH)
For 2023, VST was our largest position and our best performer (69% total return). Finally, after a few years our investment thesis has started to play out. We believe there were several reasons for VST’s outperformance. First, electricity prices and forward curves were elevated during the first three quarters of the year, which resulted in positive financial updates and guidance over the short to mid-term. Second, the acquisition of Energy Harbor (OTC:ENGH) announced in March was viewed favorably given the nuclear capacity additions the transaction brings. Third, higher margins, less competition, and customer retention has resulted in increased profitability in the oft maligned retail segment; and management teams throughout the sector believe this trend is sustainable. And finally, a paradigm shift has started to occur in terms of how investors think about the terminal value of power generation assets.
Changing Perceptions
Despite the significant gain in VST’s share price last year, we continue to believe that the current equity value trades at a large discount to intrinsic value. Our conviction in this mispricing is partly based on our view that the terminal value of VST’s asset portfolio is significantly higher than the market gives credit. Why else would a stable, yet growing business still have a cost of equity in excess of 20%? Terminal value has consistently been one of the biggest valuation concerns for deregulated power companies, and that’s largely a byproduct of society’s desire to eliminate any form of power generation that produces carbon emissions or radioactive waste.
Consider the evolution of coal fired generation in the US. Total nameplate capacity of coal generation peaked in 2011 at 318 gigawatts (GWs), currently stands at 183GWs, and will decline to 116GWs by 2030. Within a twenty-year period, coal fired capacity will decline by 64%! Coal plant closures were caused by two primary reasons: 1) competition from natural gas and renewables, and 2) environmental regulations. The rationale behind the environmental regulations was well founded. Coal emissions contained not only carbon, but numerous toxic particles responsible for environmental and human degradation. Environmental regulations required generators to either install mitigation devices or they were forced to retire early. Most operators of coal plants chose retirement. As a result, the US grid has become less stable.
Another example to consider is the story of nuclear in Germany. In 2010, 15% of Germany’s generation capacity was nuclear and roughly 25% of all electricity consumed came from Germany’s fleet of nuclear reactors. From an economic standpoint, Germany’s massive industrial base reaped significant benefits from the lower-than-average cost of electricity, as compared to Germany’s European peers. From an energy security standpoint, Germany was also far less reliant on other countries (i.e., Russia). But in March 2011, a major earthquake and tsunami catastrophically damaged Japan’s Fukushima nuclear plant, which in turn sparked a global movement to shutdown nuclear power plants. Just two months after Fukushima, the German anti-nuclear constituency compelled German Chancellor Angela Merkel to announce the immediate, early retirement of 8.3GW of nuclear (roughly half of the country’s nuclear generation capacity) and to phase out the remaining nuclear plants by 2022 (notably, the US shut down more than two dozen plants during that time!).
This is the terminal value conundrum that an investor in power generation must consider. One could purchase a profitable coal, nuclear, or gas plant with an estimated useful life of 30+ years, but then have the government step in and force its closure at any point prior to year 30. While we think the market value of VST’s shares continues to demonstrate this conundrum, VST management has pounced on the price to value mismatch that is currently reflected in the power generation sector by aggressively buying back its own shares as well as buying highly accretive third-party assets.
Energy Harbor & Nuclear Upside
Units 3 and 4 of the Vogtle nuclear power plant, owned by Southern Company (SO), started construction in 2013. The estimated cost to complete both units (2.2GWs total) was $14 billion. In July 2023, after years of design delays, cost overruns, bankruptcy, lawsuits, and a regulatory standoff, Vogtle Unit 3 finally began producing power (Unit 4 is expected to come online in early 2024). The total cost of the first nuclear reactors to be completed in the US in more than 30 years is now expected to be at least $34 billion ($34B / 2,200 MW =
$15.45M per MW). A few months prior to the start-up of Unit 3, VST announced that it would pay ~$4.5 billion1 to acquire Energy Harbor, an independent power generator with an asset portfolio that includes 4GW of nuclear ($4.5B / 4,048 MW = $1.1M per MW, which is a 93% discount to Vogtle). Even after accounting for significant depreciation for the nuclear plants and adding in the rest of the asset portfolio, it looks like VST got a smoking hot deal.
And in contrast to Germany, the US is currently experiencing something akin to a nuclear energy revival. 2024 will mark the beginning of federal financial support for nuclear power via the nuclear production tax credit (PTC). The nuclear PTC, which was enshrined in the Inflation Reduction Act (IRA), was one of many financial incentives meant to spur the US further along the ‘energy transition’ path. While slightly complex to calculate, the PTC ensures that electricity generated from merchant nuclear facilities will earn up to
$15/MWh when the market price of electricity falls below a predefined threshold. This may not seem like much, but the cash flow uplift for VST/ENGH could be an incremental $750M (~17% of pro forma EBITDA). It should also be noted that the nuclear PTC is indexed to inflation, which obviously supports VST’s growth outlook without investing any growth capital. Constellation Energy (CEG), the largest nuclear generator in the US, offers another good readthrough as to how meaningfully accretive this transaction could be for VST. Over the last 12 months, CEG raised EBITDA guidance twice, from an initial midpoint of $3.4B to $4.2B (a 24% increase).
Going back to why we still believe VST is undervalued, a more direct comparison with CEG is warranted. Allow us to use CEG management’s preferred way of describing the company, which is that they are the largest producer of carbon free electricity in the US. CEG owns and operates 21GW of nuclear generation, 9GW of gas/oil generation, and a retail segment. A business mix not too dissimilar from VST, but the valuation similarities are stark. CEG generates less EBITDA and less free cash flow than VST (even before factoring in the ENGH acquisition) but has an enterprise value nearly 70% higher than VST, and a market cap 166% higher. Based on the pro forma guidance for VST/ENGH, the business is currently valued at 5.8x EBITDA (vs. CEG at 11x) and a FCF yield of 20% (vs. CEG at 8%).
This begs the question, is CEG simply overvalued? Certainly not if valued by the replacement cost of their assets. Using Vogtle’s cost as a reference, the replacement cost for CEG’s nuclear generation portfolio alone points to an enterprise value of ~$325B (more than 600% higher than its current EV). But even if one were to apply the nosebleed multiples of the ‘magnificent seven2’ (21x EV/EBITDA, 2.5% FCF yield, and 37x P/E), the upside in CEG equity would still be greater than 200% (also worth noting that CEG grew cash flows 33% last year while the ‘mag seven’ grew by 17%). The point being, if CEG looks cheap, VST looks like a steal! So why then is there such a large valuation gap between CEG and VST? We think this is primarily due to investor appetite for carbon-free energy and how CEG’s management frames the investment case. The effort to cut emissions is necessary, but recent energy security and reliability crises suggest to us that a balance between idealism and pragmatism is returning to the market.
Energy Security & Reliability
For better or for worse, crises and catastrophes almost always usher in change. Take for example the 1973 oil embargo, which consequently led to the first and largest US government subsidies for renewable energy. As discussed previously, Japan’s Fukushima nuclear disaster resulted in a decade long phase-out of nuclear energy facilities in several countries across the globe. The Russian invasion of Ukraine, which has led to the ongoing European energy crises, highlights the importance of energy security. Sanctions against Russia have effectively eliminated 37% of European natural gas imports and 25% of crude oil imports, forcing European countries to frantically search for alternatives. As a result, EU member states had to delay nuclear shutdowns and even restart coal-fired power plants. Not only were previously achieved environmental goals at least partially reversed, but higher energy prices (both in terms of electricity and feedstocks) have wrecked the industrial intensive economies of several European states.
Even emerging crises like climate change are having a transformative and debatably negative impact on energy security and reliability. Recent super storms, fires, droughts, floods, and extreme temperature events have created an acute sense of urgency to address carbon emissions, no matter the cost. But there are lessons to be learned from the 73′ oil embargo, Fukushima, and Russia’s use of energy as a weapon. Affordable, accessible, reliable sources of energy lead to economic prosperity. Developing nations know this, developed nations are starting to relearn this, but it’s taken a fair share of crises and disasters to get where we are today.
On February 13, 2021, Winter Storm Uri rolled into Texas. Dallas experienced temperatures of -2F, the lowest in 72 years. On February 15, the grid operator started what would become a three-day stretch of rolling blackouts. 246 deaths were attributed to the lack of power, 2/3rd from hypothermia. The root-cause could be boiled down to planning. The grid operator didn’t expect this level of demand and power plant operators didn’t anticipate such cold temperatures (which froze everything from coal piles and gas pipelines to the blades on wind turbines).
No single resource was to blame for the power outage in Texas. However, in terms of reliability, natural gas and nuclear power plants performed better than the rest. Storms like Uri are becoming more frequent (or at least our perception of them is), while at the same time demand is growing and our power stack is becoming less stable. This isn’t hyperbole – in the year 2000, the entire US grid experienced less than two dozen power disruptions. In 2020, the number of power disruptions increased to more than 180 (+650%). And not only are power disruptions becoming more frequent, but the duration of power outages
has grown as well (see Figure 1). Electricity customers in the US experienced an average of 7 hours of lost power from 2020-22, compared with just 3.5 hours ten years ago.3
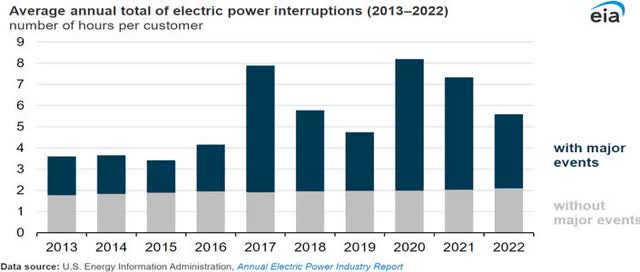 Source: EIA |
Figure 1
The objective here is not to disparage renewable energy for displacing conventional energy (i.e., natural gas, nuclear, hydro, and coal), or to allocate blame for making the grid less stable, but rather to emphasize the growing importance and value of non-intermittent sources of energy. Because renewable energy is intermittent, and thus unable to respond to price signals, the value of reliable power is reflected in the volatility of power markets. Power prices move in 15-minute increments that reflect supply and demand. Looking at power prices over the past five years best demonstrates how resource scarcity has influenced power markets (see Figure 2 – ERCOT prices are excluded due to extreme volatility).
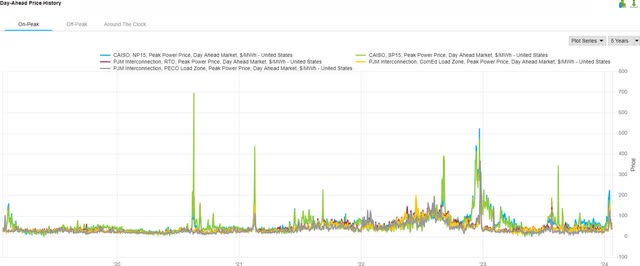 Peak power prices from 2020-present ((Source: FactSet)) |
Figure 2
VST was a major beneficiary from power scarcity events in 2023, which allowed the company to not only beat and raise guidance this year, but also provide 2024 guidance that was far above what the market expected. If there’s one thing we’ve learned from economics, it’s that when high demand meets low supply, higher prices follow.
Critical Infrastructure
Part of the reason we invest in American energy infrastructure is because it’s almost impossible to construct these days (not just oil and gas, but renewables as well!). The regulatory hurdles are nearly insurmountable, but that also makes the existing conventional energy asset class increasingly scarce, particularly in power generation.
Additionally, the merchant power sector is small for a reason (only four public companies) – it’s an intensely cyclical and volatile industry. Deregulated power markets are impossible to predict over the short term (weather and commodity prices) and the mid to longer term outlooks have always been predicated on a shrinking asset base. All of that has changed. Nuclear is not only back in (relative) flavor, but it’s now highly profitable given the nuclear PTC. International sentiment towards natural gas has troughed, as evidenced by the codifying of natural gas as a transition fuel by both the UN and the EU. And, when lives and economies are at stake, even coal makes a resurgence (Germany).
If we can finally sidestep the terminal value question for power producers, we might sensibly begin considering the replacement value of assets owned by companies like VST/ENGH (total generation capacity of 42GW = $27B enterprise value; total capacity of Vogtle Units 3 & 4 is 2.2GW = Price tag $34B). We’re still waiting for at least some of that value to be realized, which is why VST remains our largest position.
Sincerely,
Kris & Nate 1-27-2024
Footnotes
- Total consideration for ENGH was $3B in cash, assumption of $430M debt, and a 15% economic interest in Vistra Vision (5.8x EBITDA of $2.4B minus net debt ($515M))
- The Magnificent Seven are Apple, Microsoft, Alphabet, Amazon, Nvidia, Meta, and Tesla
- U.S. electricity customers averaged five and one-half hours of power interruptions in 2022 – U.S. Energy Information Administration (EIA)
Disclaimer
This letter is for informational purposes only and does not reflect all of the positions bought, sold, or held by Legacy Ridge Capital Partners Equity Fund I, LP. Any performance data is historical in nature and is not an indication of future results. All investments involve risk, including the loss of principal. Legacy Ridge Capital Management LLC disclaims any duty to provide updates to the information contained within this letter.
This letter may include forward-looking statements. These forward-looking statements involve known and unknown risks, uncertainties, assumptions and other factors which may cause actual results and performance to be materially different from any future results and/or performance expressed or implied by such forward looking statements.
Performance for 2018 is provided by Richey May & Associates, our auditor, and was provided via a Performance Review for a separate account that was transferred into the Fund and constituted 100% of the assets of the Fund as of November 1, 2018. Results are net of fund expenses. All performance related figures for the Partnership are unaudited.
Indices are provided as market indicators only. It should not be assumed that any investment vehicles managed by Legacy Ridge Capital Management will, or intend to, match provided indices in holdings, volatility or style. Index returns supplied are believed to be accurate and reliable.
The S&P 500 is a market capitalization weighted index that measures the performance of the 500 largest US based companies. The Russell 2000 Index is a market capitalization weighted index that measures the performance of the smallest 2000 stocks in the Russell 3000 Index and is a common benchmark for smaller companies. The MSCI World Index is a market capitalization weighted index that is designed to be a broad measure of equity-market performance throughout the world. It is comprised of stocks from 23 developed countries and 24 emerging markets.
The AMZ is an index provided by Alerian and measures the return of 32 Master Limited Partnerships on a total return basis. The S&P 500 Energy sub-index comprises those companies included in the S&P 500 that are classified as members of the GICS energy sector. There are currently 28 constituents in the S&P 500 Energy sub-index. The XAL is the NYSE Arca Airline Index. There are currently 14 constituents in the XAL, with most domiciled in the US.
This letter does not constitute an offer or solicitation to buy an interest in Legacy Ridge Capital Partners Equity Fund I, LP. Such an offer may only be made pursuant to the delivery of an approved confidential private offering memorandum to an investor. This reporting does not include certain information that should be considered relevant to an investment in Legacy Ridge Capital Managements investment vehicles, including, but not limited to significant risk factors and complex tax considerations. For more information please refer to the appropriate Memorandum and read it carefully before you invest.
Original Post
Editor’s Note: The summary bullets for this article were chosen by Seeking Alpha editors.
Read the full article here


 Stock: The Next Data Center PPA")


